Friday, 19 July 2024
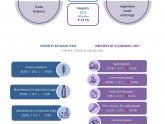
In the first six months of 2024, exports amounted to USD 38.2 billion (they grew 14.0% y-o-y), while imports totalled USD 27.5 billion (they fell 27.7% y-o-y), which resulted in a trade surplus of USD 10.7 billion.
Highlights
- In the first half of 2024, exports grew 14.0% in year-on-year terms, amounting to USD 38.2 billion, thanks to a 23.5% increase in the quantities exported that exceeded the 7.7% drop in prices.
- Imports reached USD 27.5 billion and decreased 27.7% in year-on-year terms, due to falls of 4.9% and 23.9% in prices and quantities imported, respectively. This is mainly due to lower prices of intermediate goods and to a reduction in the imported quantities of fuels and lubricants and parts and accessories for capital goods; and, to a lesser extent, of capital goods and consumer goods. To the contrary, imports of motor vehicles increased, due to a rise in quantities.
- As a result, the trade balance recorded a surplus by USD 10.7 billion, while in the first half of 2023 it had seen a deficit of USD 4.5 billion.

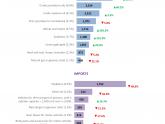
- Prominent are the increases in exports of wheat (USD 1.1 billion, mainly to Brazil and Indonesia), soybeans (USD 958 million) and crude petroleum oils (USD 952 million); while falls in unwrought silver (-USD 145 million) and in vehicles for the transport of goods (-USD 120 million) stand out.
- In relation to the soybean complex, the prices of biodiesel (-26.1%), beans (-21.0%), crude oil (-19.0%) and flour and pellets (-17.8%) fell. Regarding the quantities exported, beans (301.3%), flour and pellets (46.8%), crude oil (27.8%) and biodiesel (27.5%) increased.
- In terms of imports, the most significant reductions were observed in the purchases of soybeans (-USD 1.7 billion), parts of telephones and broadcasting devices (-USD 792 million) and liquefied natural gas (-USD 783 million); while the most outstanding growths were in parts of gas turbines (USD 108 million) and vehicles for transport of persons (USD 92 million).

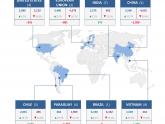
- The main export destinations were Brazil (with a 16.2% share), China (9.4%), the EU (9.1%), the United States (7.6%) and Chile (7.4%). In turn, the most relevant imports originated from Brazil (22.5%), China (16.8%), the EU (15.9%) and the United States (11.4%).
- The largest surpluses were obtained in trade with Chile (USD 2.6 billion), Vietnam (USD 1.3 billion), Peru (USD 1.1 billion), India (USD 973 million), Indonesia (USD 686 million) and Saudi Arabia (USD 708 million); while the highest deficits were recorded with China (-USD 1.0 billion), Paraguay (-USD 1.2 billion) and Germany (-USD 870 million).

Documentos relacionados:


