Wednesday, 21 August 2024
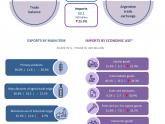
In the first seven months of 2024, exports reached USD 45.4 billion (they went up 14.8% year-on-year), while imports amounted to USD 33.1 billion (they fell 25.9 % y-o-y). The trade balance resulted in a USD 12.3 billion surplus.
Highlights
- In the January-July 2024 period, exports reached USD 45.4 billion, representing a year-on-year rise of 14.8%. This is accounted for by a 23.8% increase in exported quantities that exceeded the 7.3% drop in prices.
- Imports totalled USD 33.1 billion and decreased 25.9% year-on-year, as a result of the 5.2% and 21.9% falls in prices and quantities imported, respectively. This is primarily due to lower prices of intermediate goods and reductions in the imported quantities of fuels and lubricants, and, to a lesser extent, of parts and accessories of capital goods, consumer goods and capital goods. Contrarily, the imports of motor vehicles went up, caused by a rise in quantities.
- As a consequence, the trade balance reached a USD 12.3 billion surplus, while in the first seven months of 2023, a USD 5.2 billion deficit had been recorded.

- The imports of crude petroleum oils (USD 1.23 billion), wheat (USD 1.19 billion, mainly to Brazil and Indonesia), soybean flour and pellets (USD 1.17 billion) and soybeans (USD 1.10 billion) can be highlighted; while the largest falls occurred in vehicles for the transport of persons (‑USD 210 million), barley grains (‑USD 169 million) and vehicles for the transport of goods (‑USD 150 million).
- In relation to the soybean complex, the prices of biodiesel (‑24.6%), beans (‑21.3%), crude oil (‑20.3%) and flour and pellets (‑17.8%) fell down. As for the quantities exported, those of beans (326.7%), and biodiesel (75.2%), flour and pellets (49.6%) and crude oil (40.7%) increased.
- With respect to imports, the most significant falls occurred in purchases of soybeans (-USD 1.8 billion), liquefied natural gas (-USD 1.1 billion) and parts of telephones and devices for broadcasting, transmitting or receiving (-USD 853 million); while those of vehicles for the transport of persons (USD 208 million) and vehicles for the transport of goods (USD 98 million) went up.

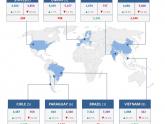
- The main destinations for exports were Brazil (with a 16.1% share), the EU (with 9.6%), the United States (with 7.9%) and Chile (with 7.7%). In turn, the origins of the most remarkable imports were: Brazil (with 22.1% of the total imported), China (with 16.9%), the EU (with 15.6%), and the United States (with 11.6%).
- The largest surpluses were obtained in trade with Chile (USD 3.1 billion), Vietnam (USD 1.6 billion), Peru (USD 1.3 billion), India (USD 1.1 billion) and Indonesia (USD 753 million); while the main deficits were recorded with China (‑USD 1.5 billion), Paraguay (‑USD 1.5 billion) and Germany (‑USD 1.0 billion).

Documentos relacionados:


