Friday, 20 March 2026
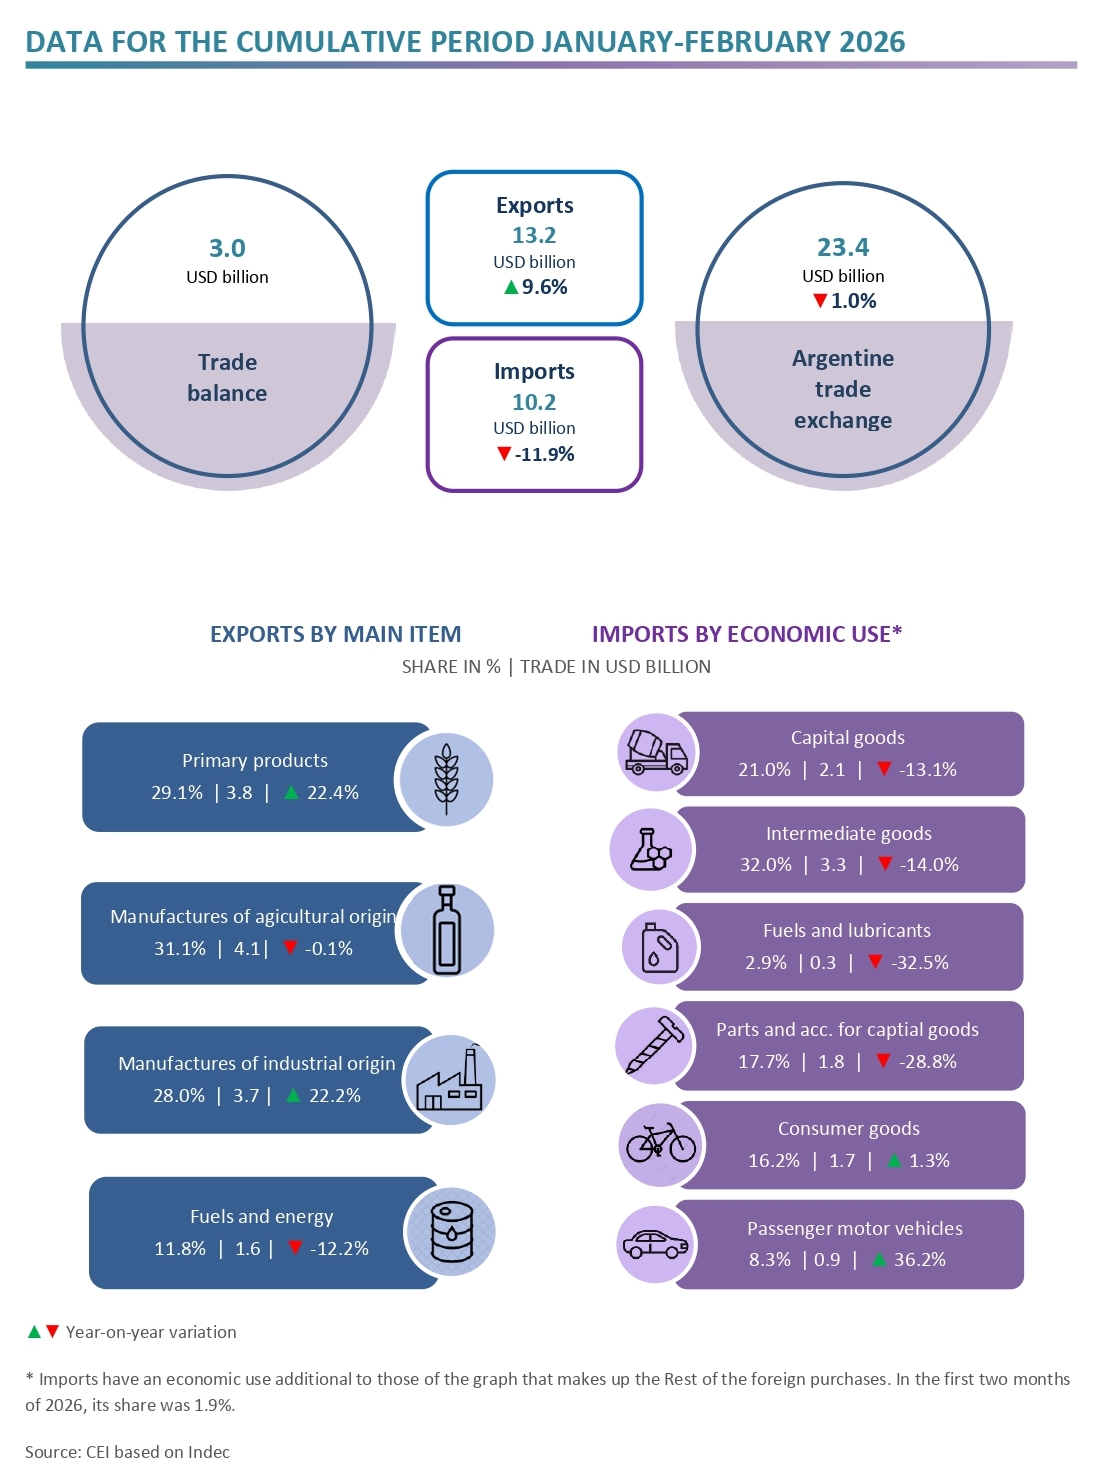
During the first two months of 2026, Argentine exports reached USD 13.2 billion (a 9.6% rise compared to the first two months of 2025), while imports totalled USD 10.2 billion (an 11.9% year-on-year fall). As a result, a trade surplus of almost USD 3.0 billion was recorded.
HIGHLIGHTS
- Between January and February 2026, exports totalled USD 13.2 billion, implying a year-on-year growth of 9.6%, as a result of an increase in both exported quantities and prices (6.2% and 3.2%, respectively).
- Imports totalled USD 10.2 billion and dropped by 11.9% year on year, as imported quantities fell by 14.0%, while prices rose 2.4% This is mainly accounted for by the lower imported quantities of parts and accessories (-33.8%) and the rise in capital goods prices (8.3%).
- As a result, the trade balance registered a surplus of almost USD 3.0 billion, when in the first half of 2025 a positive balance of USD 438 million had been recorded.

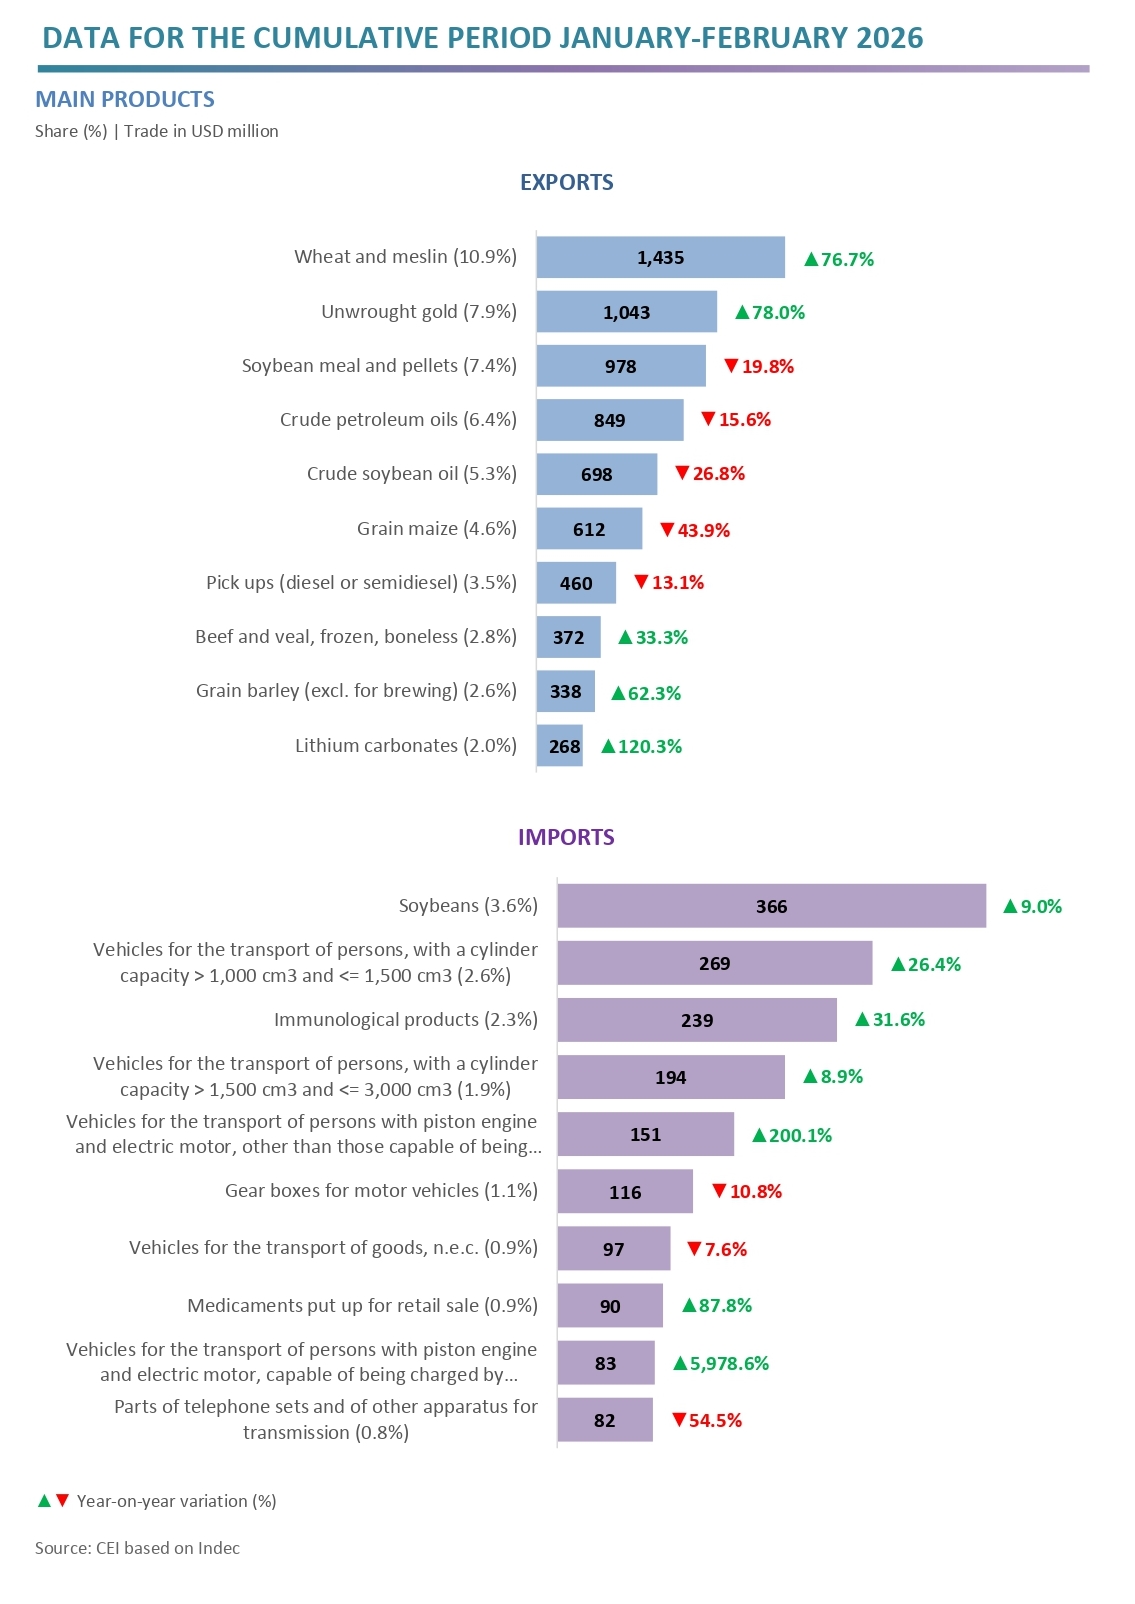
- Increases in the exports of wheat (USD 623 million), unwrought gold (USD 457 million) and sunflower seeds (USD 188 million) stand out; while the largest falls were observed in maize (-USD 480 million), soybean oil (-USD 256 million) and soybean flour and pellets (‑USD 242 million).
- In relation to the soybean complex, flour and pellets prices fell (‐4.2%), while those of crude oil (5.2%) and beans (0.7%) went up. As for the exported quantities, those of beans rose (269.9%), and those of crude oil (30.5%) and flour and pellets (16.3%) went down.
- Regarding imports, the most representative rises took place in the purchases of vehicles for propulsion without connection to external electrical load (USD 101 million), vehicles for propulsion with connection to external electrical load (USD 82 million) and smartphones (USD 59 million); while those of vehicles for the transport of people of a cylinder capacity ≤ 1,000 cm3 (-USD 99 million), parts of telephones (-USD 98 million) and diesel (-USD 86 million) decreased.

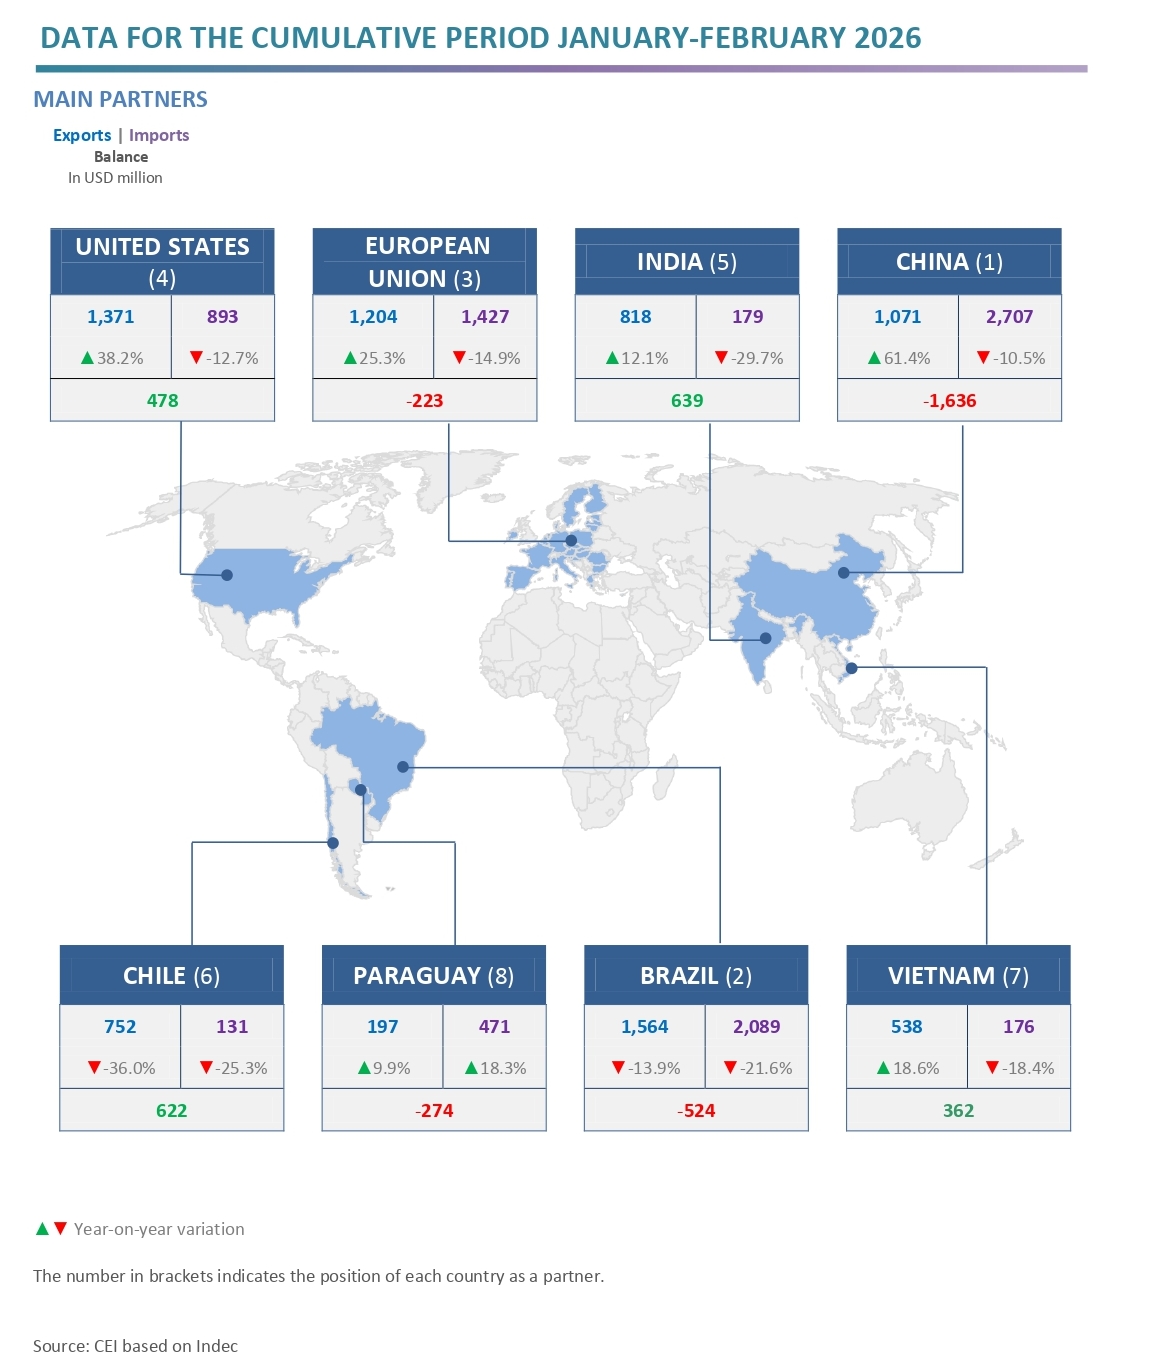
- The main export destinations were Brazil, with 11.8% share, the United States (10.4%), the EU (9.1%) and China (8.1%). Meanwhile, the origins of the most remarkable imports were China, which represented 26.5% of the total, Brazil (20.4%), the EU (13.9%) and the United States (8.7%).
- The largest surpluses were recorded in trade with India (USD 639 million), Chile (USD 622 million), the United States (USD 478 million), Vietnam (USD 362 million) and Peru (USD 331 million); while the main deficits were registered with China (-USD 1.6 billion), Brazil (-USD 524 million) and Paraguay (-USD 274 million).

Documentos relacionados:
Galería: