Friday, 20 September 2024
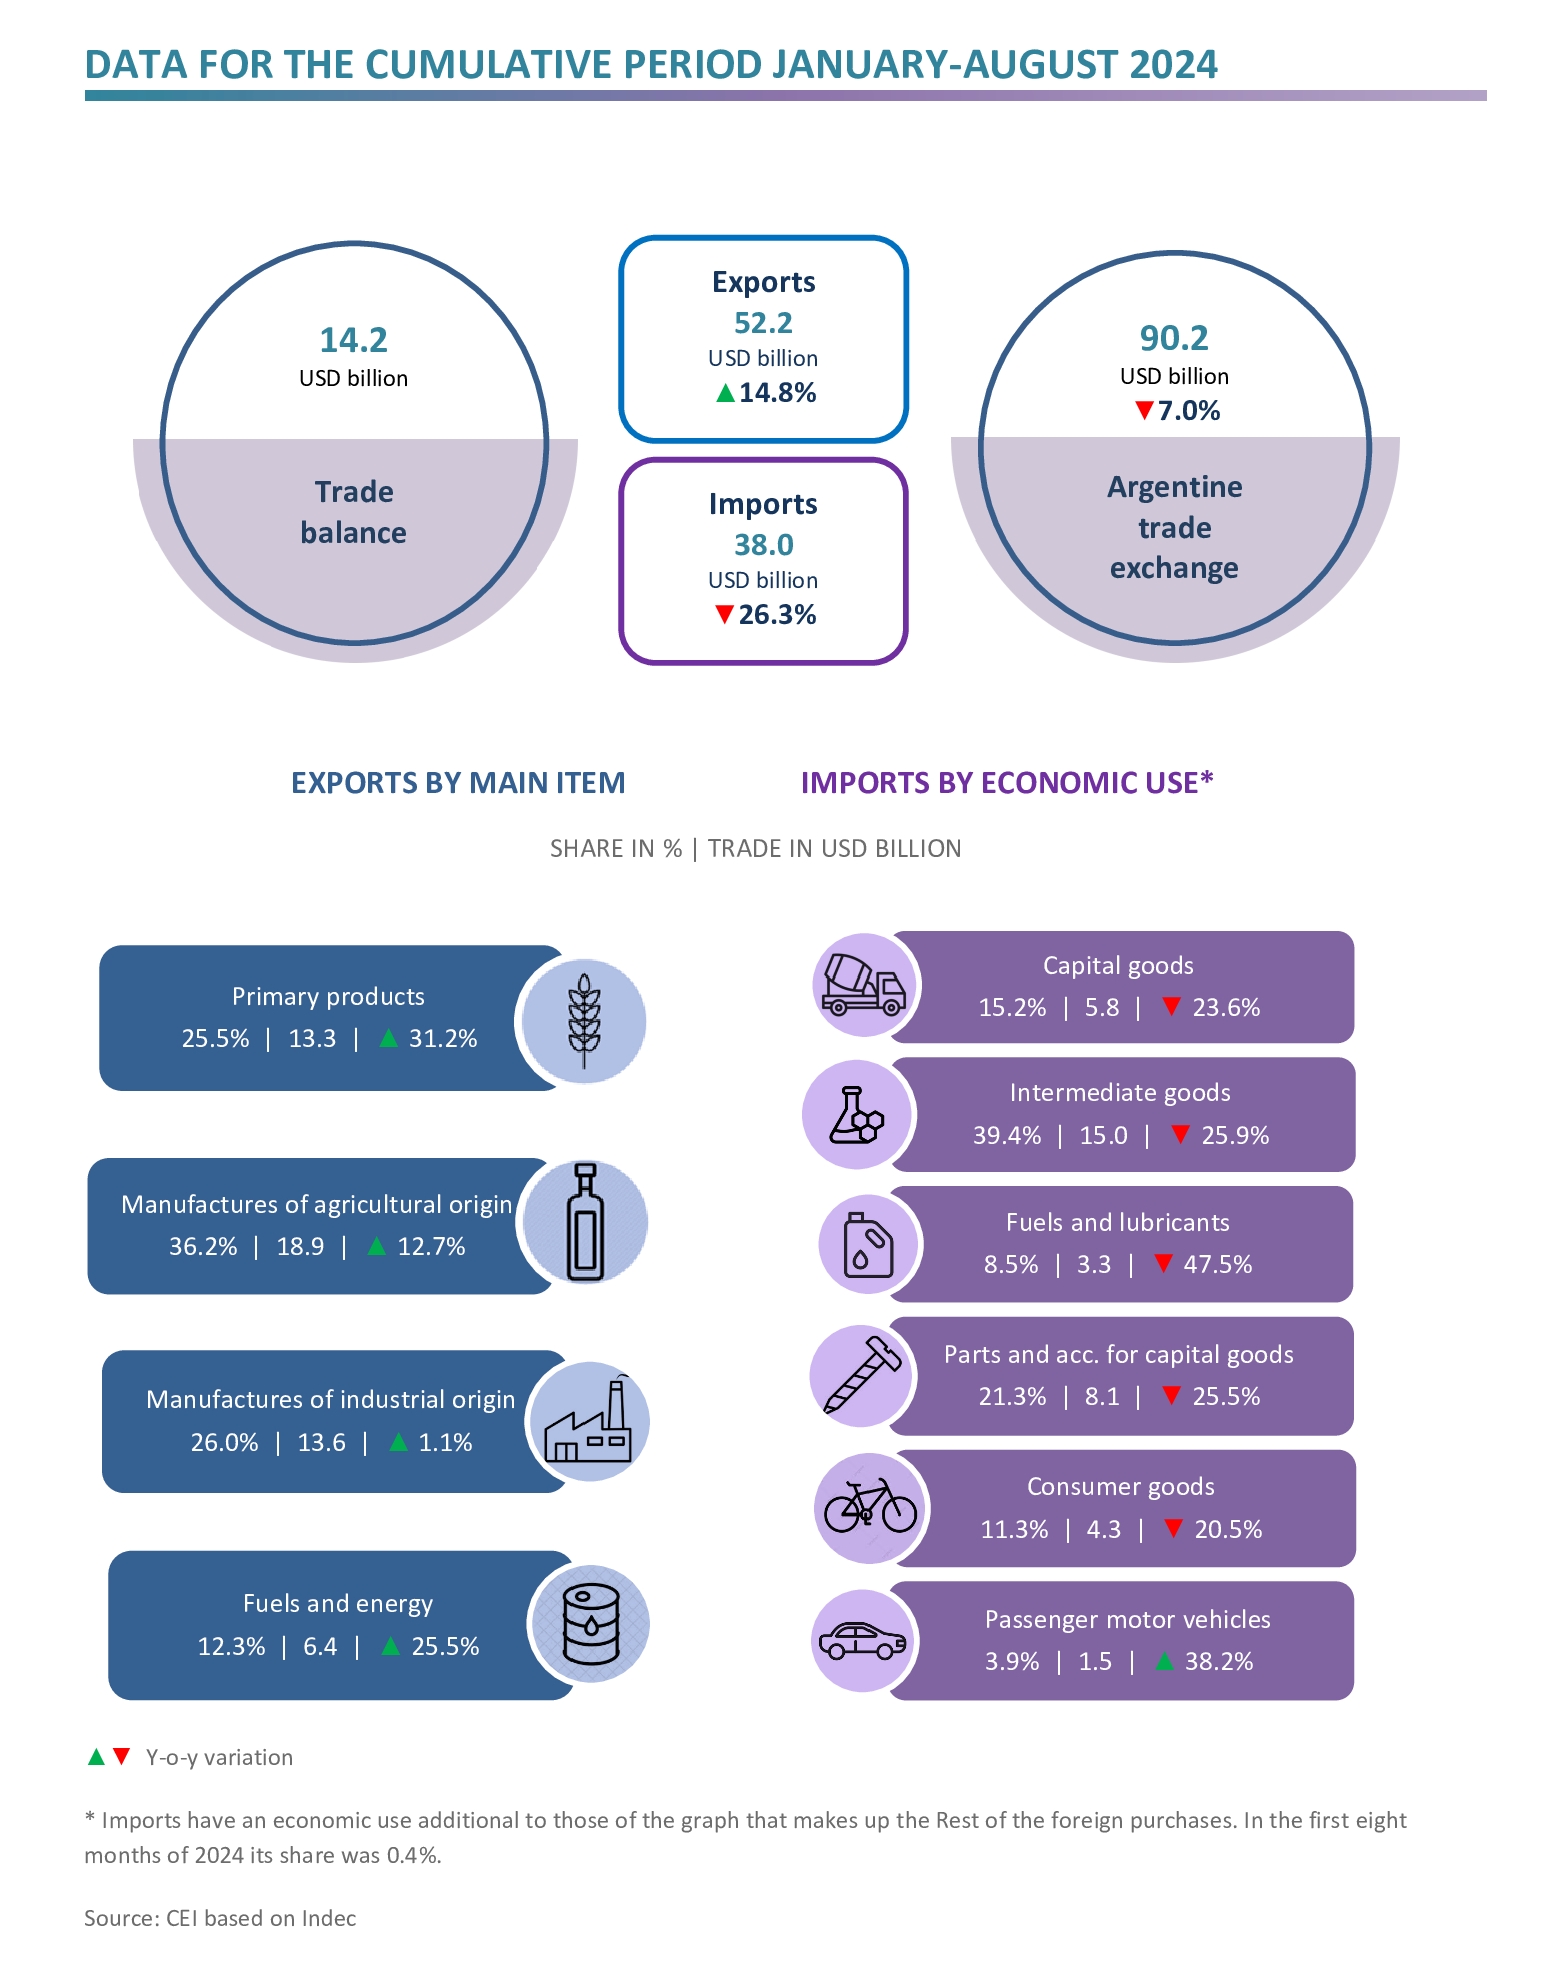
Between January-August 2024, exports grew 14.8% compared to the same period in 2023 (reaching USD 52.2 billion), while imports fell 26.3% year-on-year (totalling USD 38.0 billion). Consequently, the trade balance resulted in a surplus of USD 14.2 billion.
HIGHLIGHTS:
- In the January-August 2024 period, exports reached USD 52.2 billion, representing a year-on-year rise of 14.8%. This is accounted for by a 23.4% increase in the exported quantities that exceeded the 7.0% drop in prices.
- Imports totalled USD 38.0 billion and decreased 26.3% year-on-year, as a result of falls of 4.0% and 23.2% in prices and quantities imported, respectively. This is primarily due to lower prices of intermediate goods and reductions in the imported quantities of fuels and lubricants, and, to a lesser extent, of parts and accessories for capital goods, consumer goods and capital goods. Contrarily, the imports of motor vehicles went up, caused by a rise in quantities.
- As a consequence, the trade balance reached a USD 14.2 billion surplus, while in the first eight months of 2023, a USD 6.2 billion deficit had been recorded.

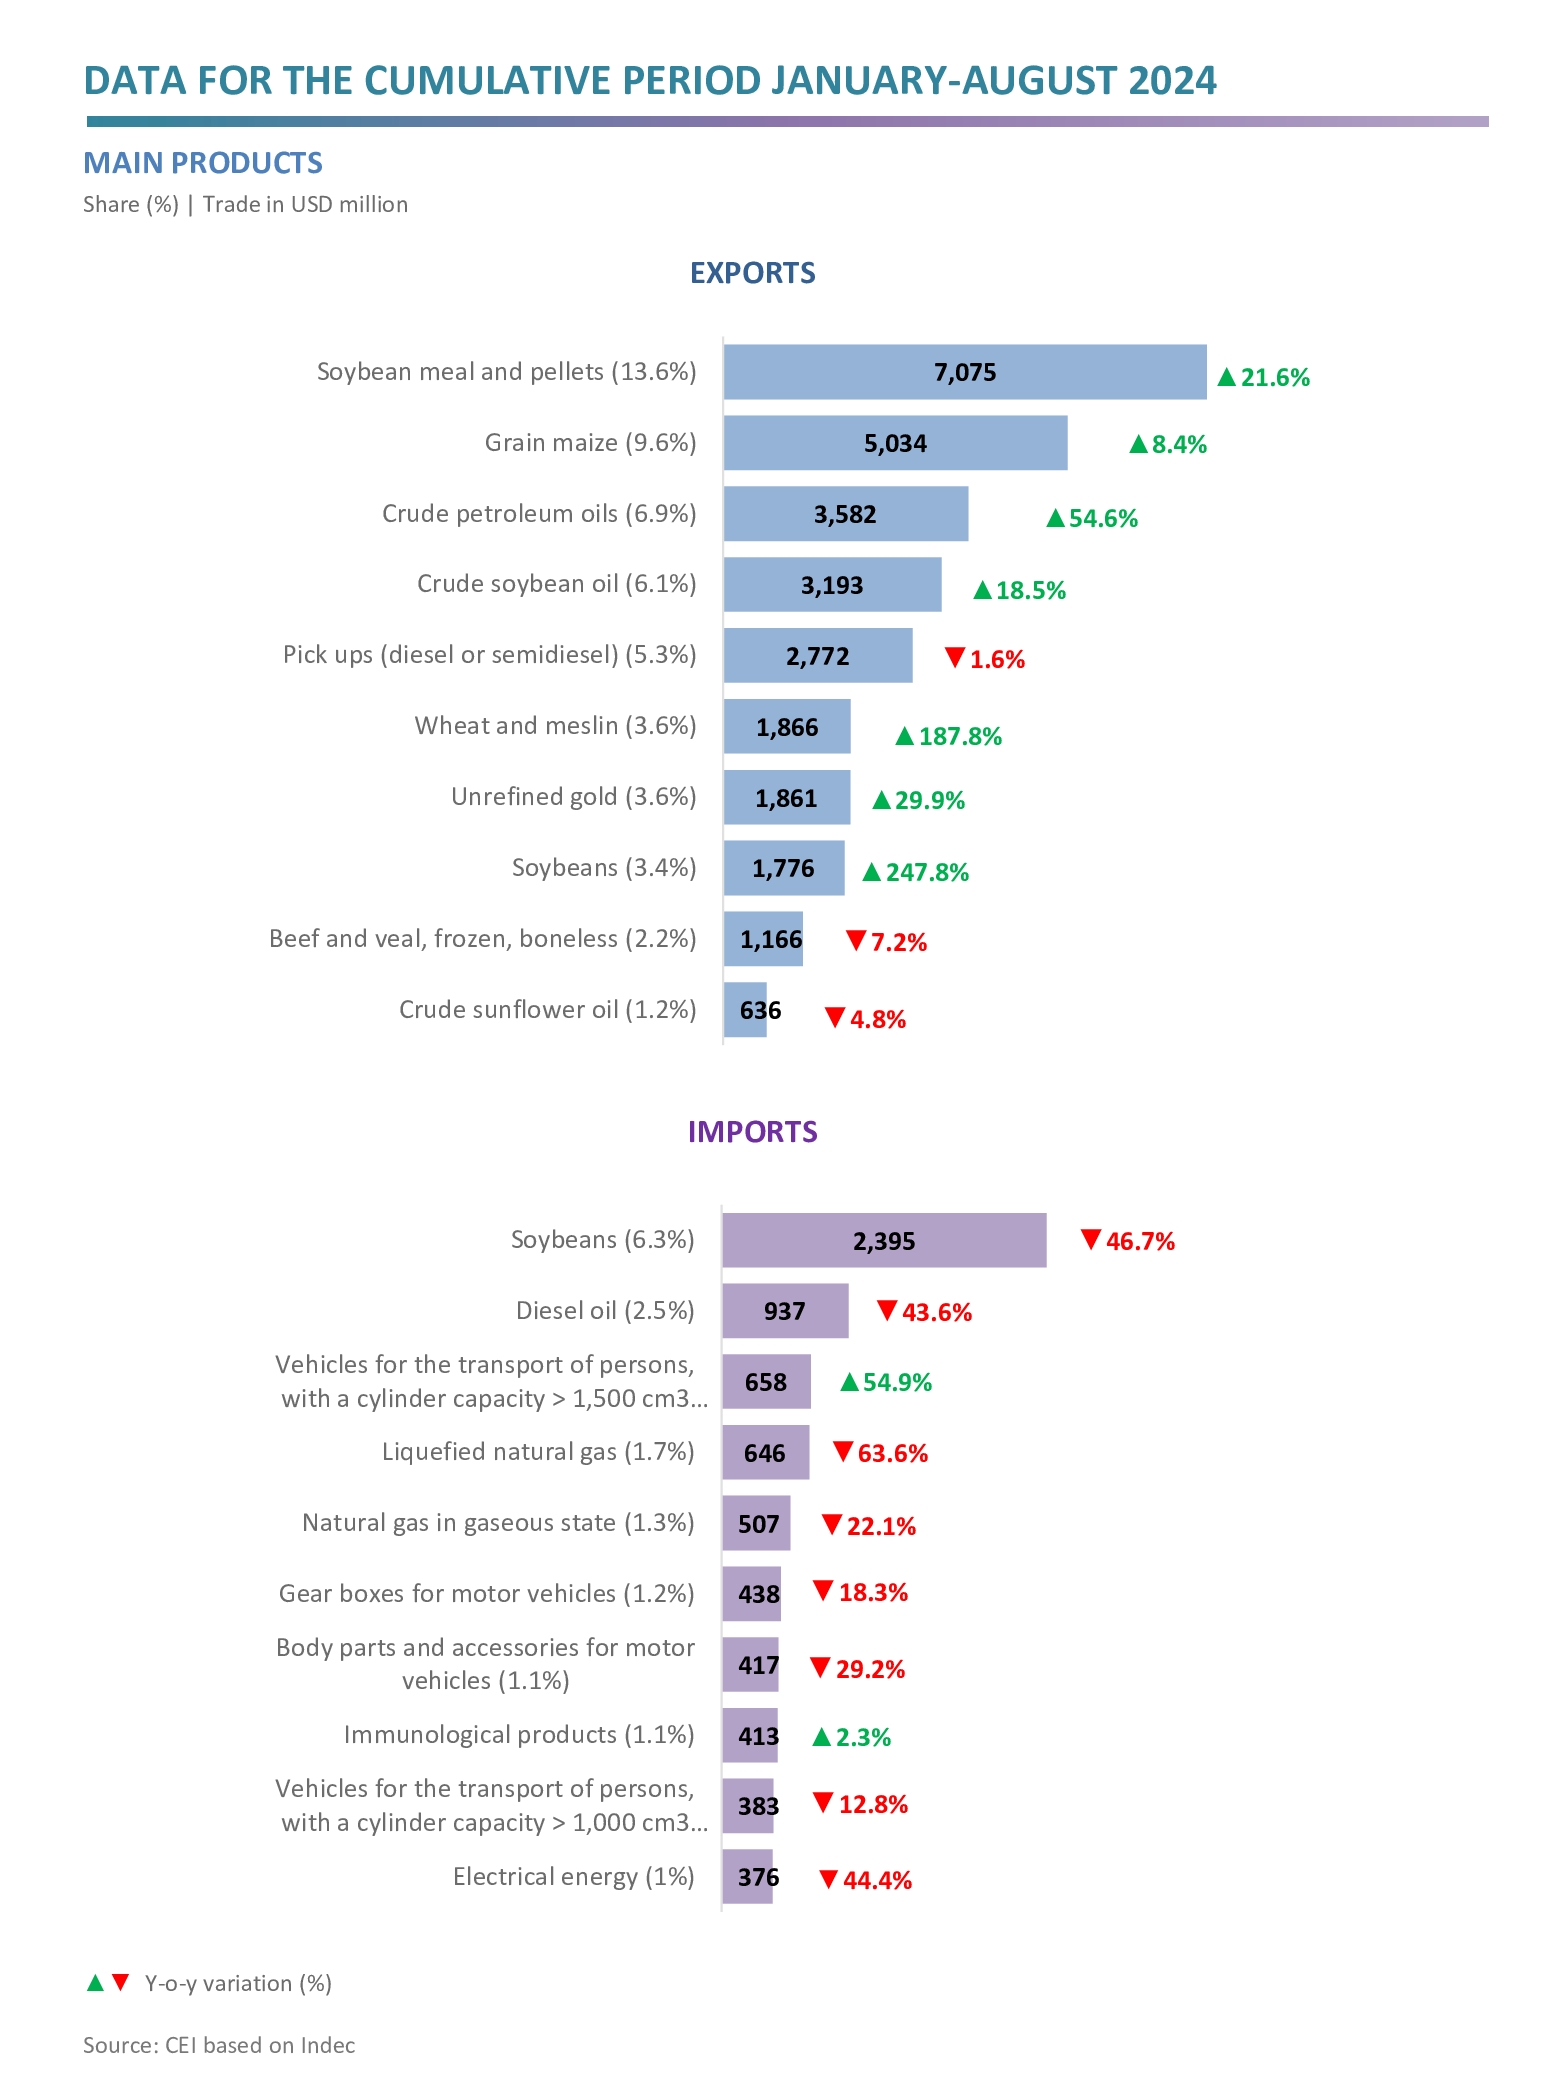
- The exports of crude petroleum oils (USD 1,265 million), soybeans (USD 1,265 million) soybean flour and pellets (USD 1,258 million) and wheat (USD 1,218 million) stood out; while the largest falls occurred in lithium carbonates (‑USD 186 million), unwrought silver (‑USD 171 million), grains of barley (‑USD 166 million) and vehicles for the transport of persons (‑USD 150 million).
- In relation to the soybean complex, the prices of beans (-22.0%), biodiesel (-20.7%), crude oil (‑19.5%) and flour and pellets (-18.3%) fell down. As for the quantities exported, those of beans (345.5%), flour and pellets (48.9%), biodiesel (47.5%), and crude oil (47.1%) increased.
- With respect to imports, the most significant falls occurred in purchases of soybeans (‑USD 2,095 million), liquefied natural gas (-USD 1,127 million) and parts of telephones and devices for broadcasting, transmitting or receiving (-USD 906 million); while those of vehicles for the transport of persons (USD 405 million) and vehicles for the transport of goods (USD 133 million) went up.

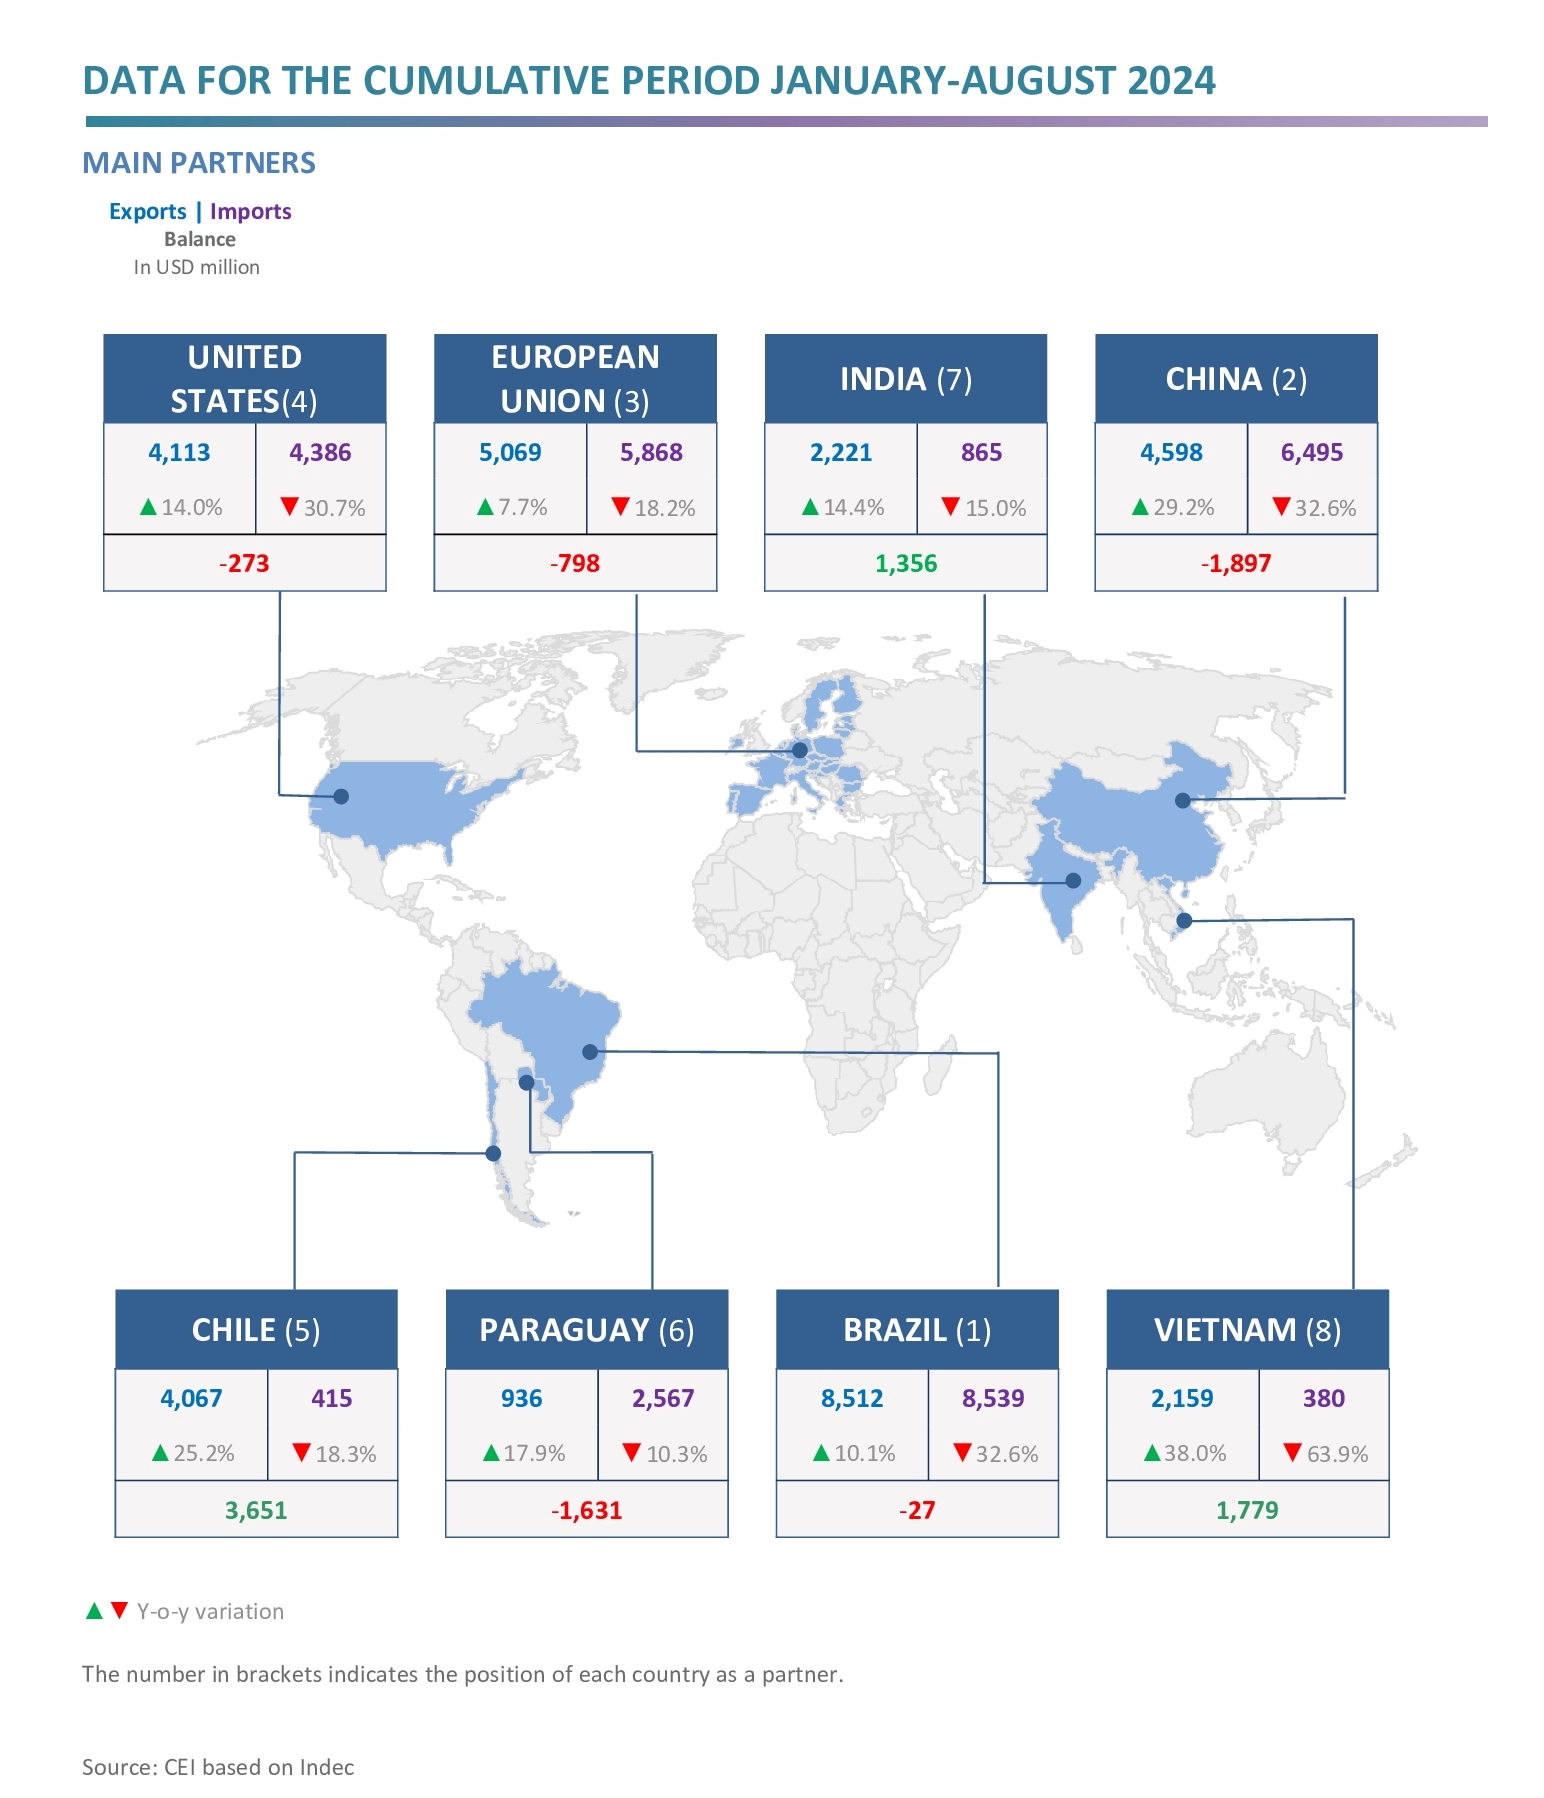
- The main exports destinations were Brazil (with a 16.3% share), the EU (with 9.7%), China (with 8.8%) and the United States (with 7.9%). In turn, the most relevant origins of imports were: Brazil (with 22.4% of the total imported), China (with 17.1%), the EU (with 15.4%), and the United States (with 11.5%).
- The largest surpluses were obtained in trade with Chile (USD 3.7 billion), Vietnam (USD 1.8 billion), Peru (USD 1.5 billion), India (USD 1.4 billion) and Saudi Arabia (USD 900 million); while the main deficits were recorded with China (‑USD 1.9 billion), Paraguay (‑USD 1.6 billion) and Germany (‑USD 1.2 billion).

Documentos relacionados:
Galería: