Wednesday, 16 April 2025
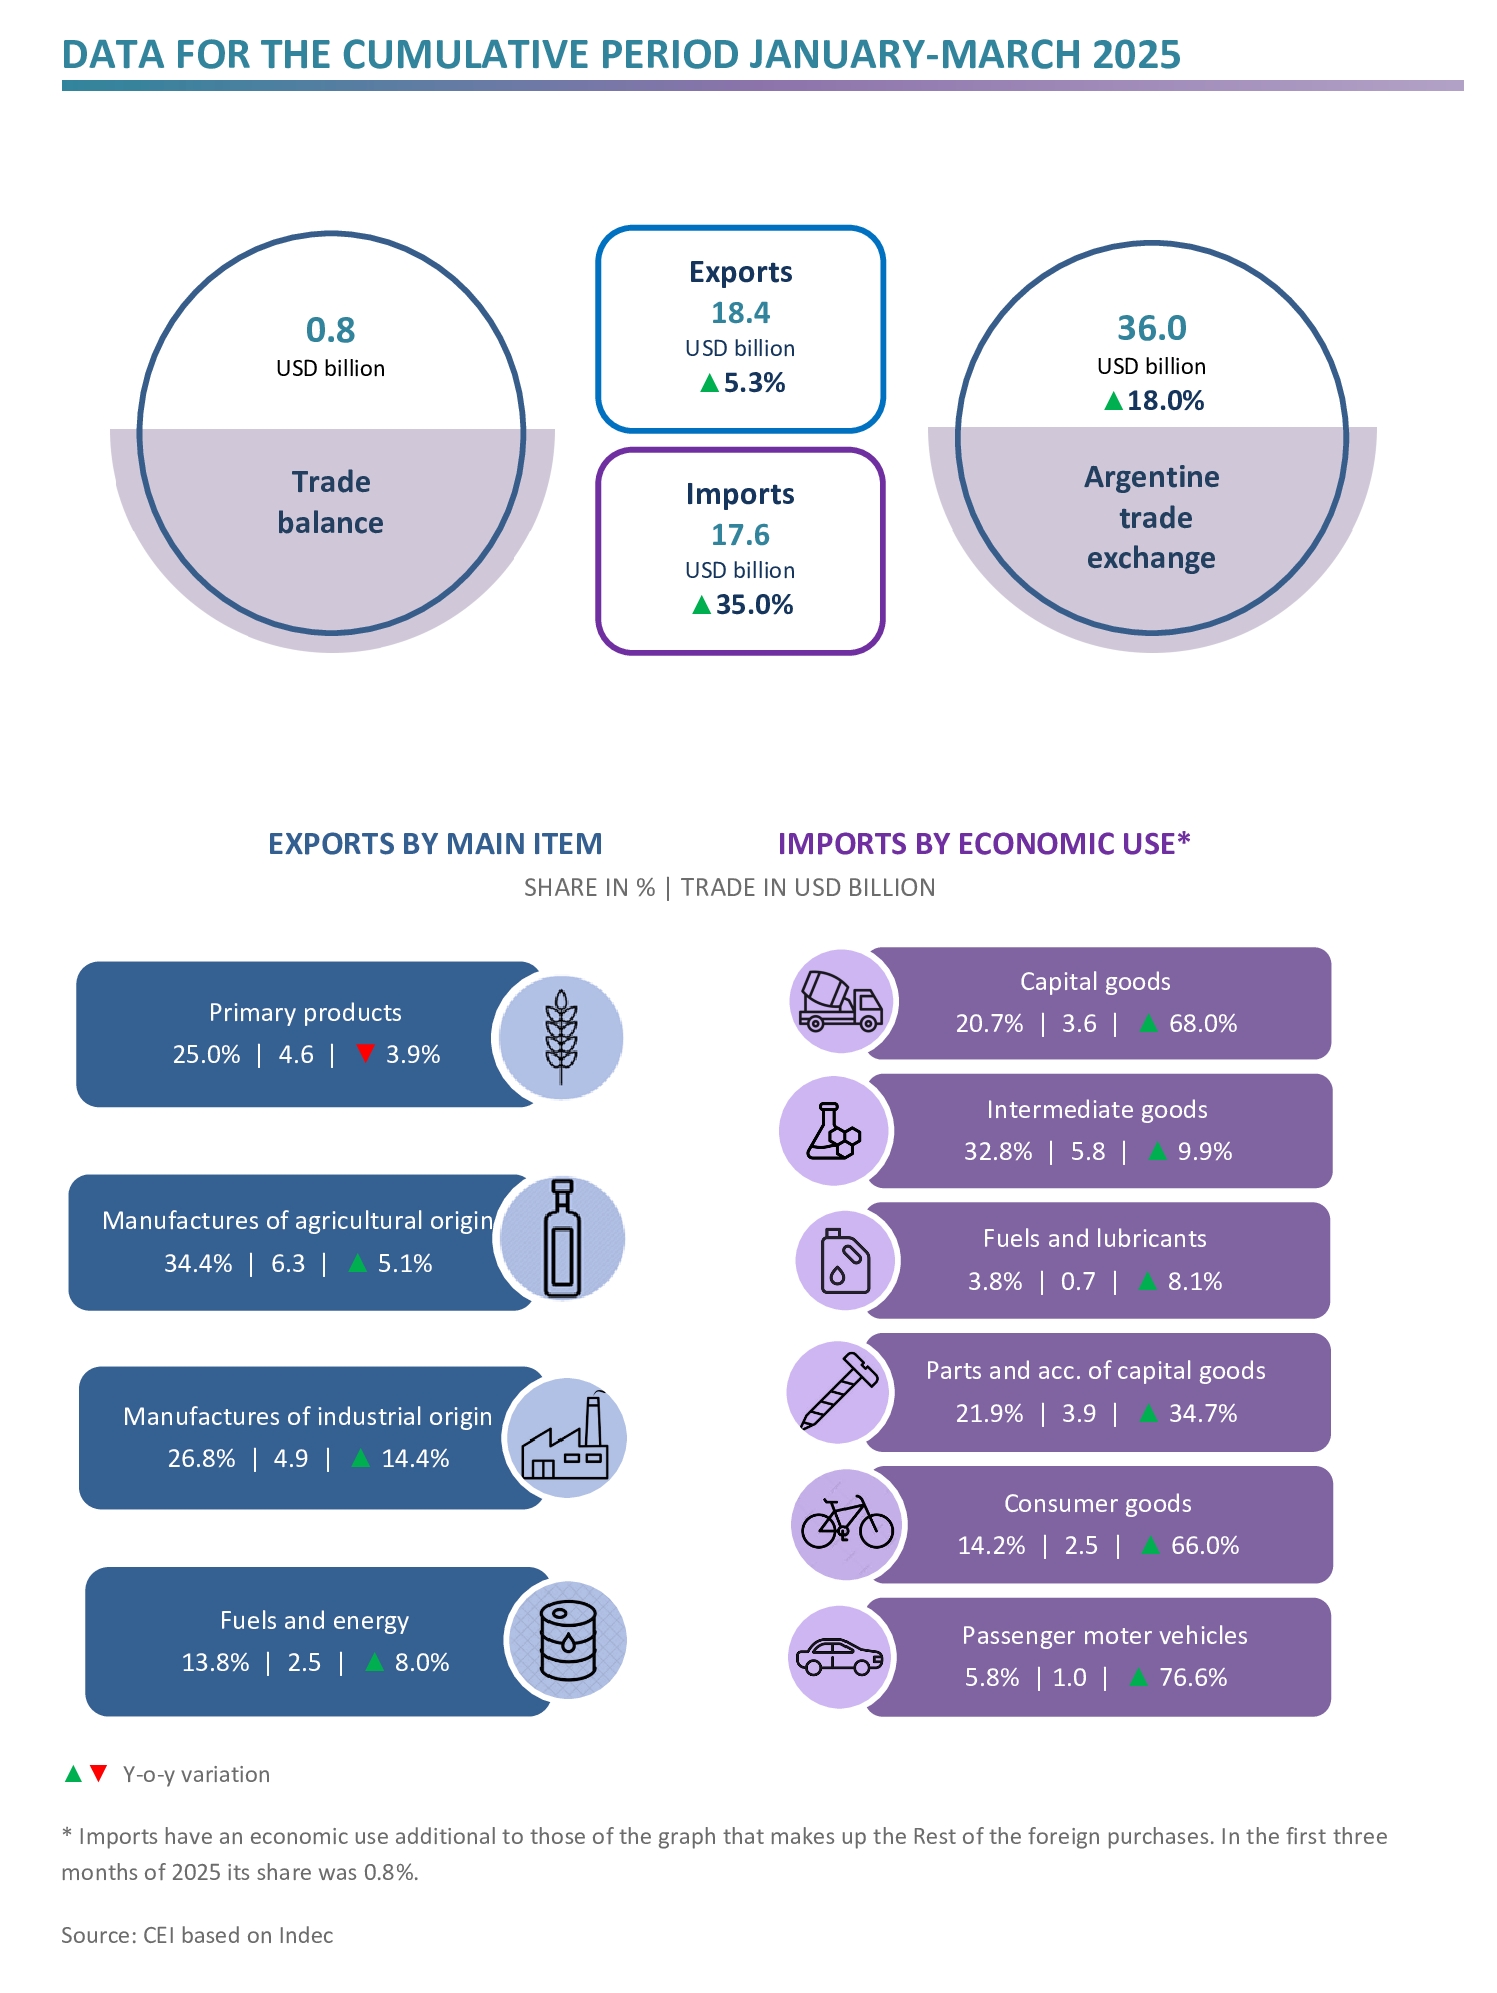
In the first three months of 2025, exports reached USD 18.4 billion (they grew 5.3% compared to the same period in 2024) while imports totalled USD 17.6 billion (a 33.0% y-o-y increase). The trade balance resulted in a USD 761 million surplus.
Highlights:
- In the first three months of 2025, exports amounted to USD 18.4 billion, which represents a 5.3% year-on-year increase, explained by a 5.9% rise in the quantities exported that exceeded the 0.6% drop in prices.
- Imports totalled USD 17.6 billion and grew 35.0% in year-on-year terms, as a result of the 45.7% increase in the imported quantities, while prices decreased by 7.4%. This is mainly due to higher quantities of passenger motor vehicles, capital goods, consumer goods and parts and accessories of capital goods.
- Consequently, the trade balance reached a surplus of USD 761 million, when in January-March 2024 a positive balance of USD 4.4 billion had been recorded.

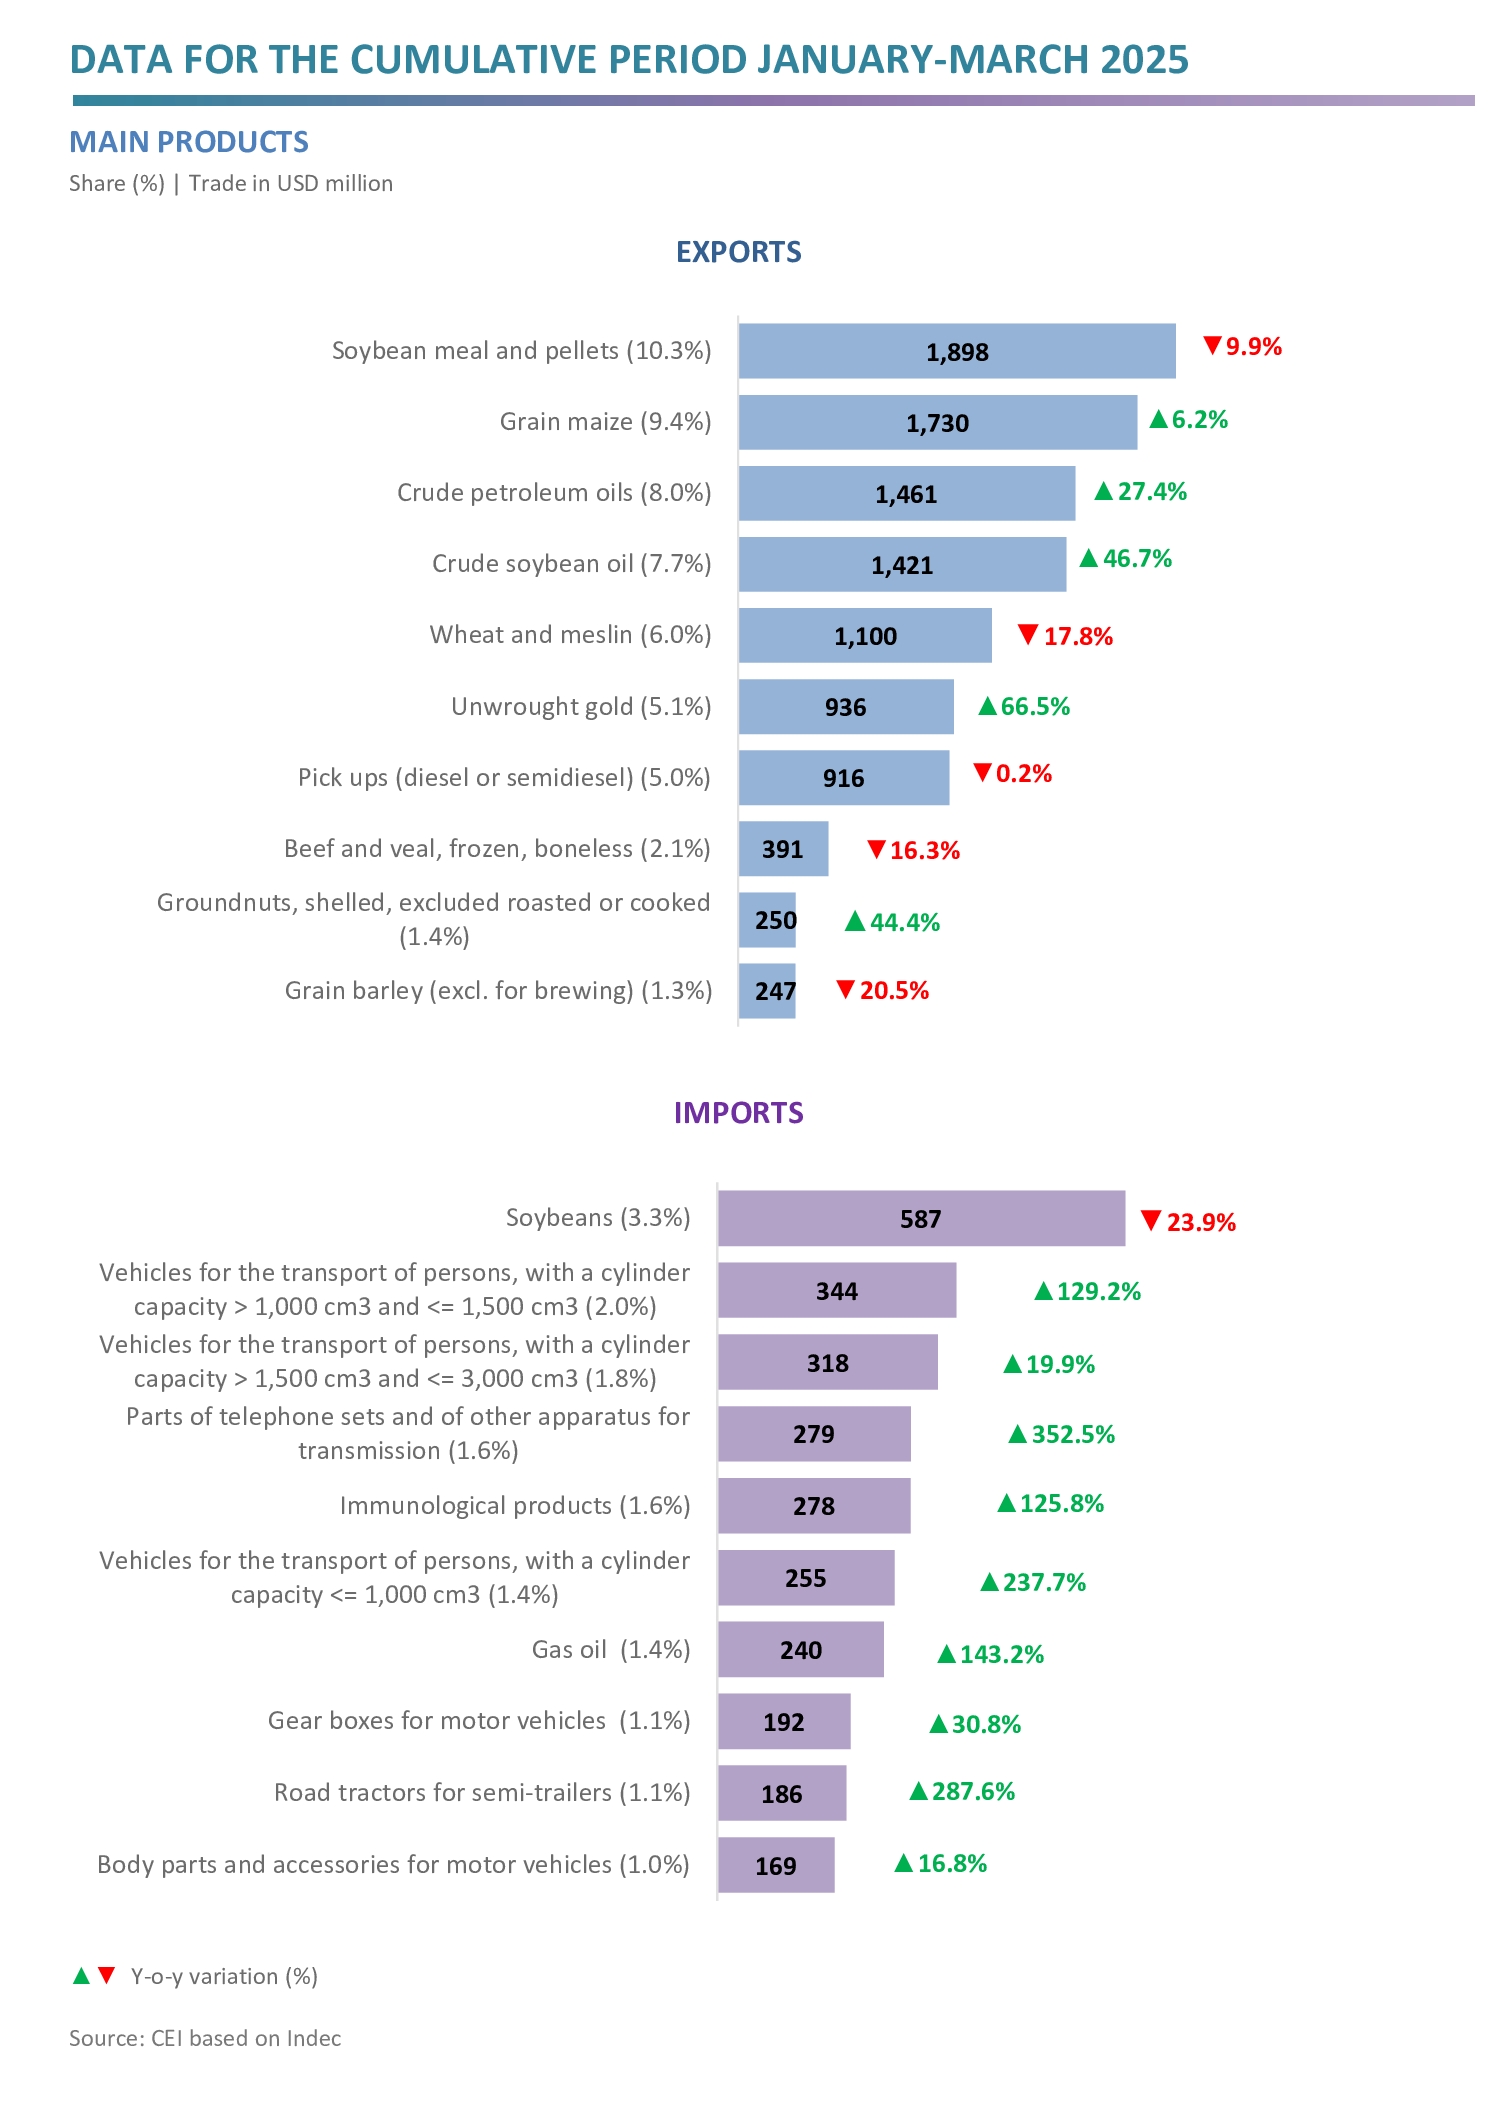
- Regarding exports, prominent was the increase in crude soybean oil (USD 453 million), unwrought gold (USD 374 million), crude petroleum oils (USD 314 million) and corn (USD 101 million); while the largest drops were seen in wheat (-USD 239 million), soybean flour and pellets (-USD 209 million) and beef and veal, frozen, boneless (-USD 76 million).
- In relation to the soybean complex, the prices of flour and pellets (‑24.2%) and beans (‑18.8%) decreased, while those of crude oil (18.9%) increased. As for the quantities exported, those of crude oil (23.4%) and flour and pellets (18.8%) increased, and those of beans (‑63.5%) decreased. There were no biodiesel exports recorded in the first three months of the year.
- Regarding imports, the most significant increases occurred in the purchases of chassis, parts and tyres (USD 496 million), vehicles for the transport of people (USD 445 million) and telephone parts (USD 217 million); whereas those of soybeans (‑USD 185 million), natural gas in gaseous state (‑USD 124 million) and electric energy (‑USD 80 million) fell.

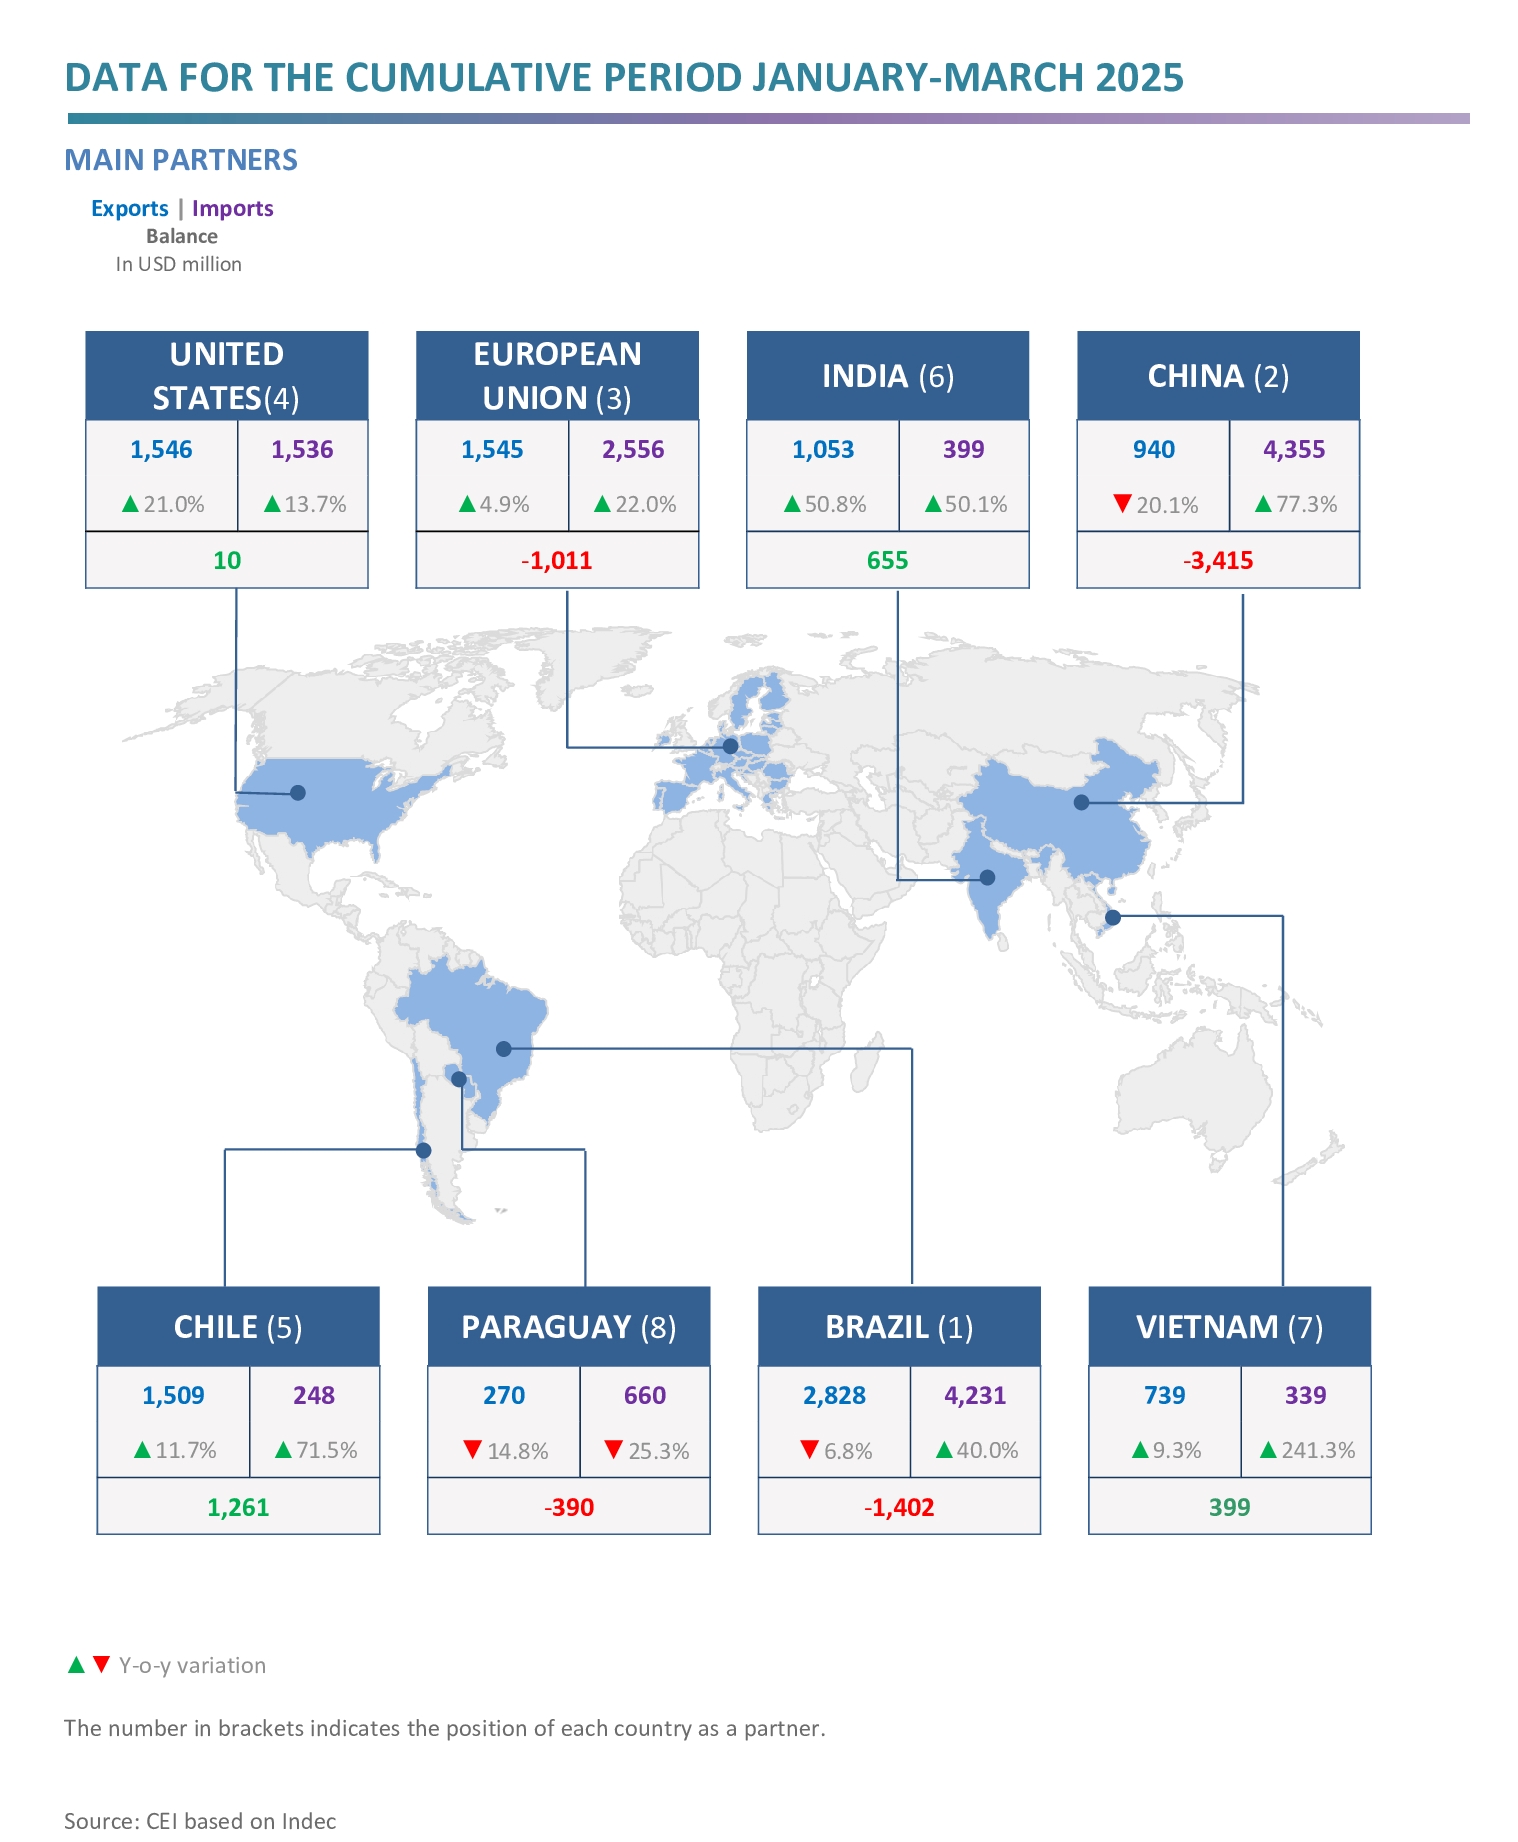
- The main export destinations were Brazil, with a 15.4% share; the United States, 8.4%; the EU, 8.4%; and Chile, 8.2%. In turn, the most outstanding sources of imports were China, 24.7% of total imports; Brazil, 24.0%; the EU, 14.5%; and the United States, 8.7%.
- The largest surpluses were obtained in trade with Chile (USD 1.3 billion), India (USD 655 million), Peru (USD 545 million), Switzerland (USD 482 million) and Saudi Arabia (USD 428 million); in turn, the main deficits were registered with China (‑USD 3.4 billion), Brazil (‑USD 1.4 billion) and Germany (‑USD 571 million).

Read the full report in Spanish here (with highlights in English).
Related documents:
Gallery: