
Friday, 19 June 2026
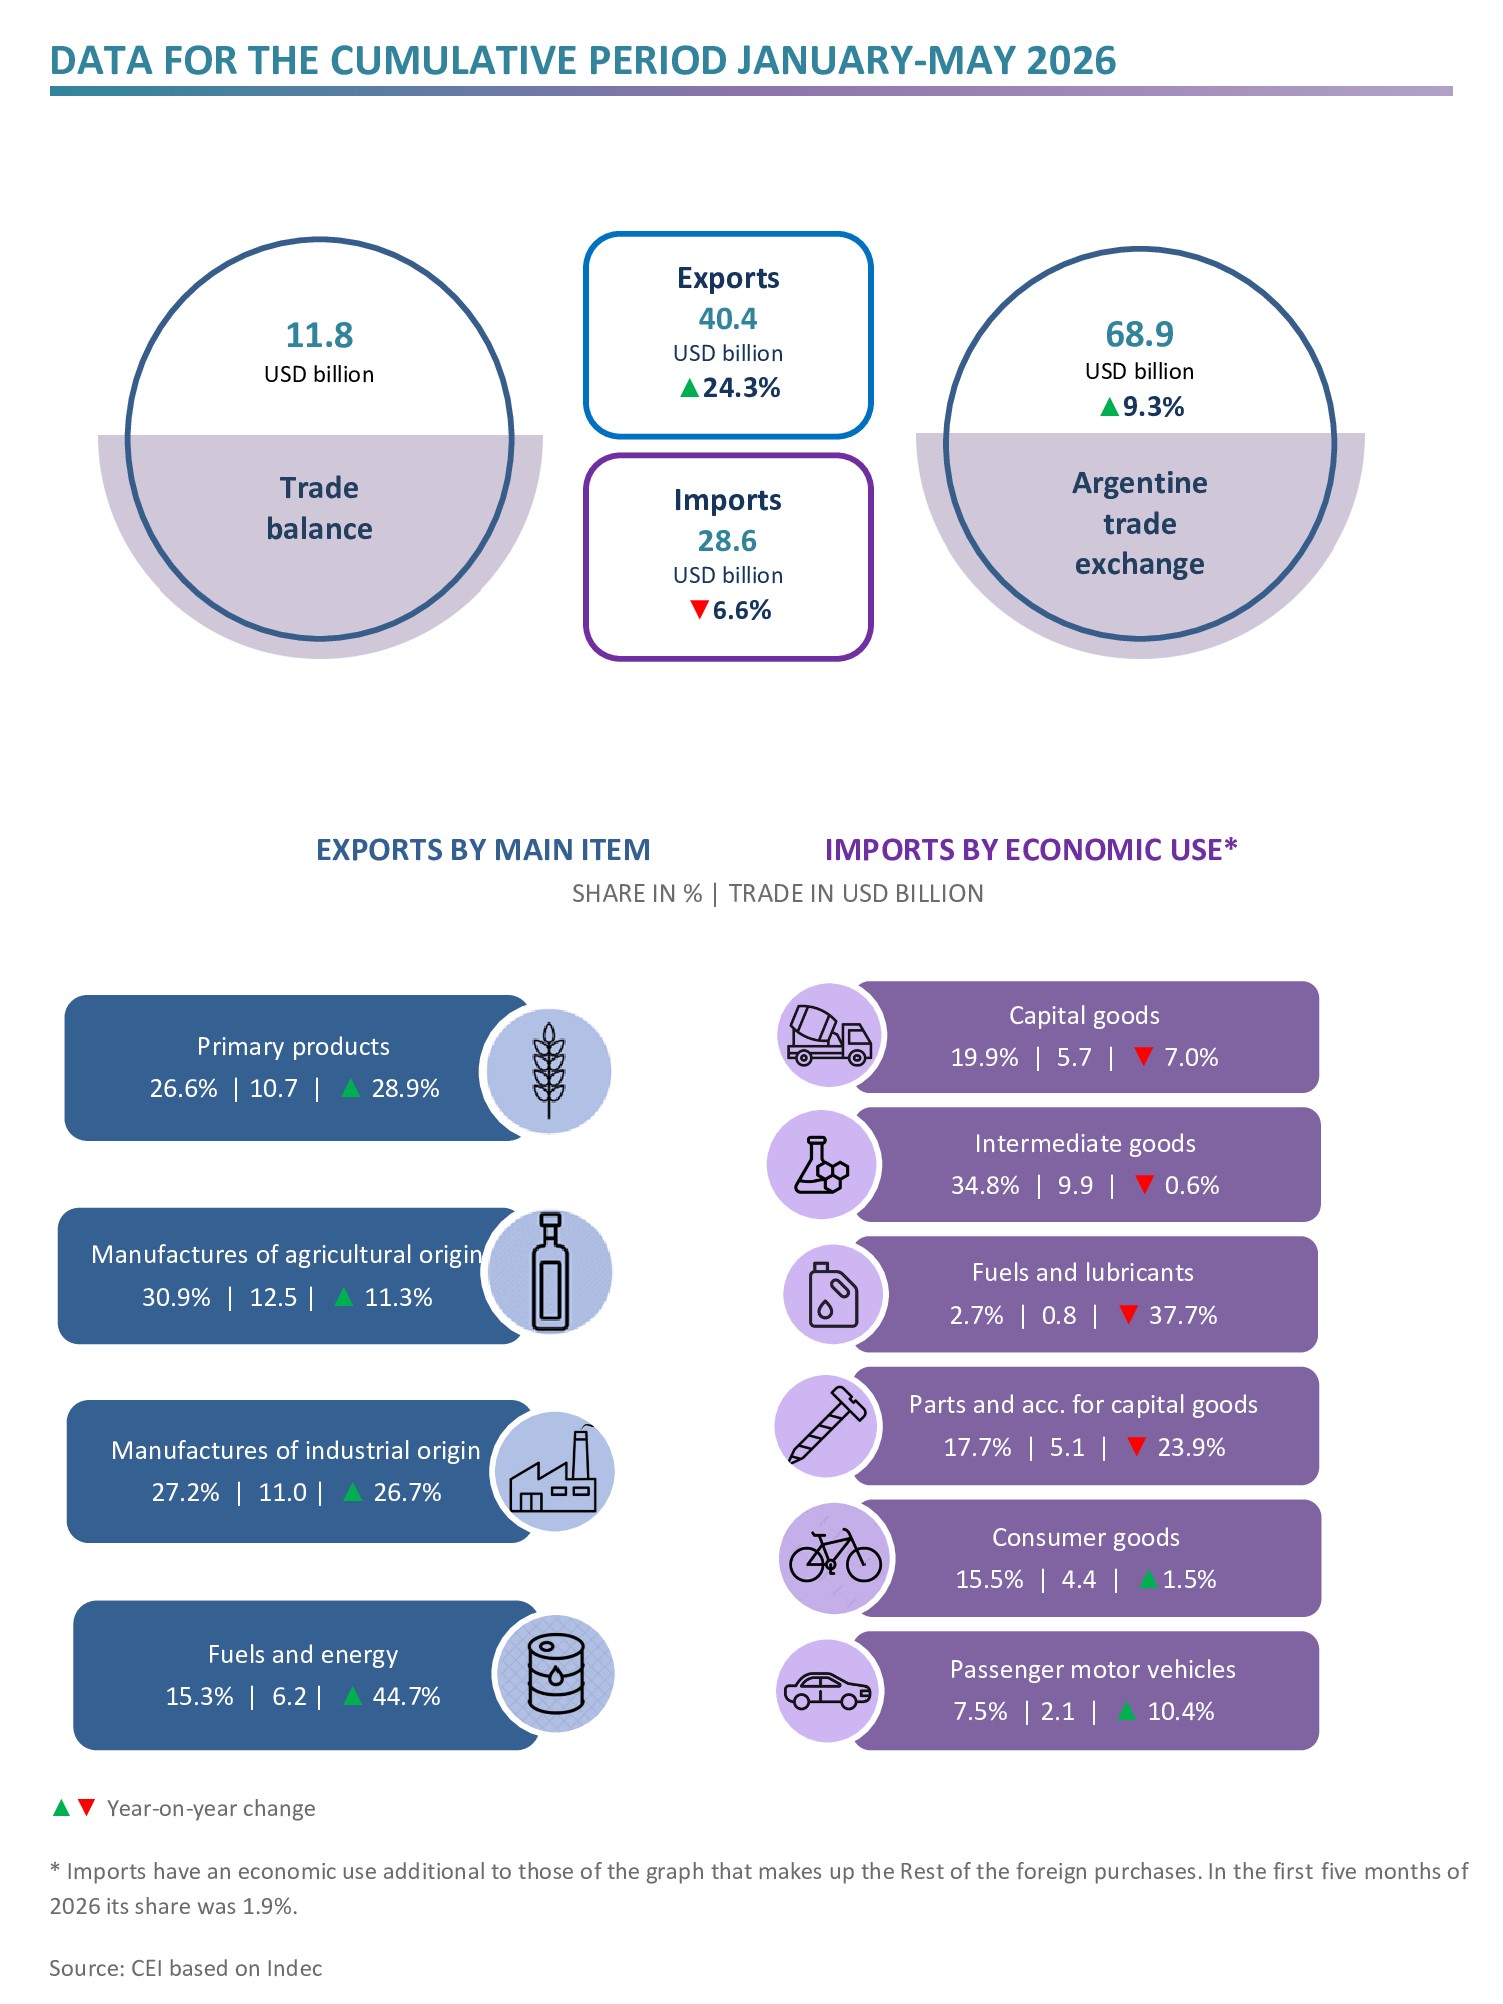
In the first five months of the year, Argentine exports reached USD 40.4 billion (a 24.3% rise compared with the same period in 2025), while imports amounted to USD 28.6 billion (a 6.6% year-on-year fall). This resulted in a trade surplus of USD 11.8 billion.
HIGHLIGHTS
- Between January and May 2026, exports amounted to USD 40.4 billion, representing year-on-year growth of 24.3%, driven by increases in both export volumes and prices (15.7% and 7.5%, respectively).
- Imports totalled USD 28.6 billion and fell by 6.6% year-on-year, as the quantities imported dropped by 10.8%, whilst prices rose by 4.7%. This is mainly due to lower volumes of capital goods (-13.7%) and their parts and accessories (-31.1%).
- As a result, the trade balance showed a surplus of USD 11.8 billion, whereas in the cumulative January–May 2025 period, a surplus of USD 1.9 billion had been recorded.
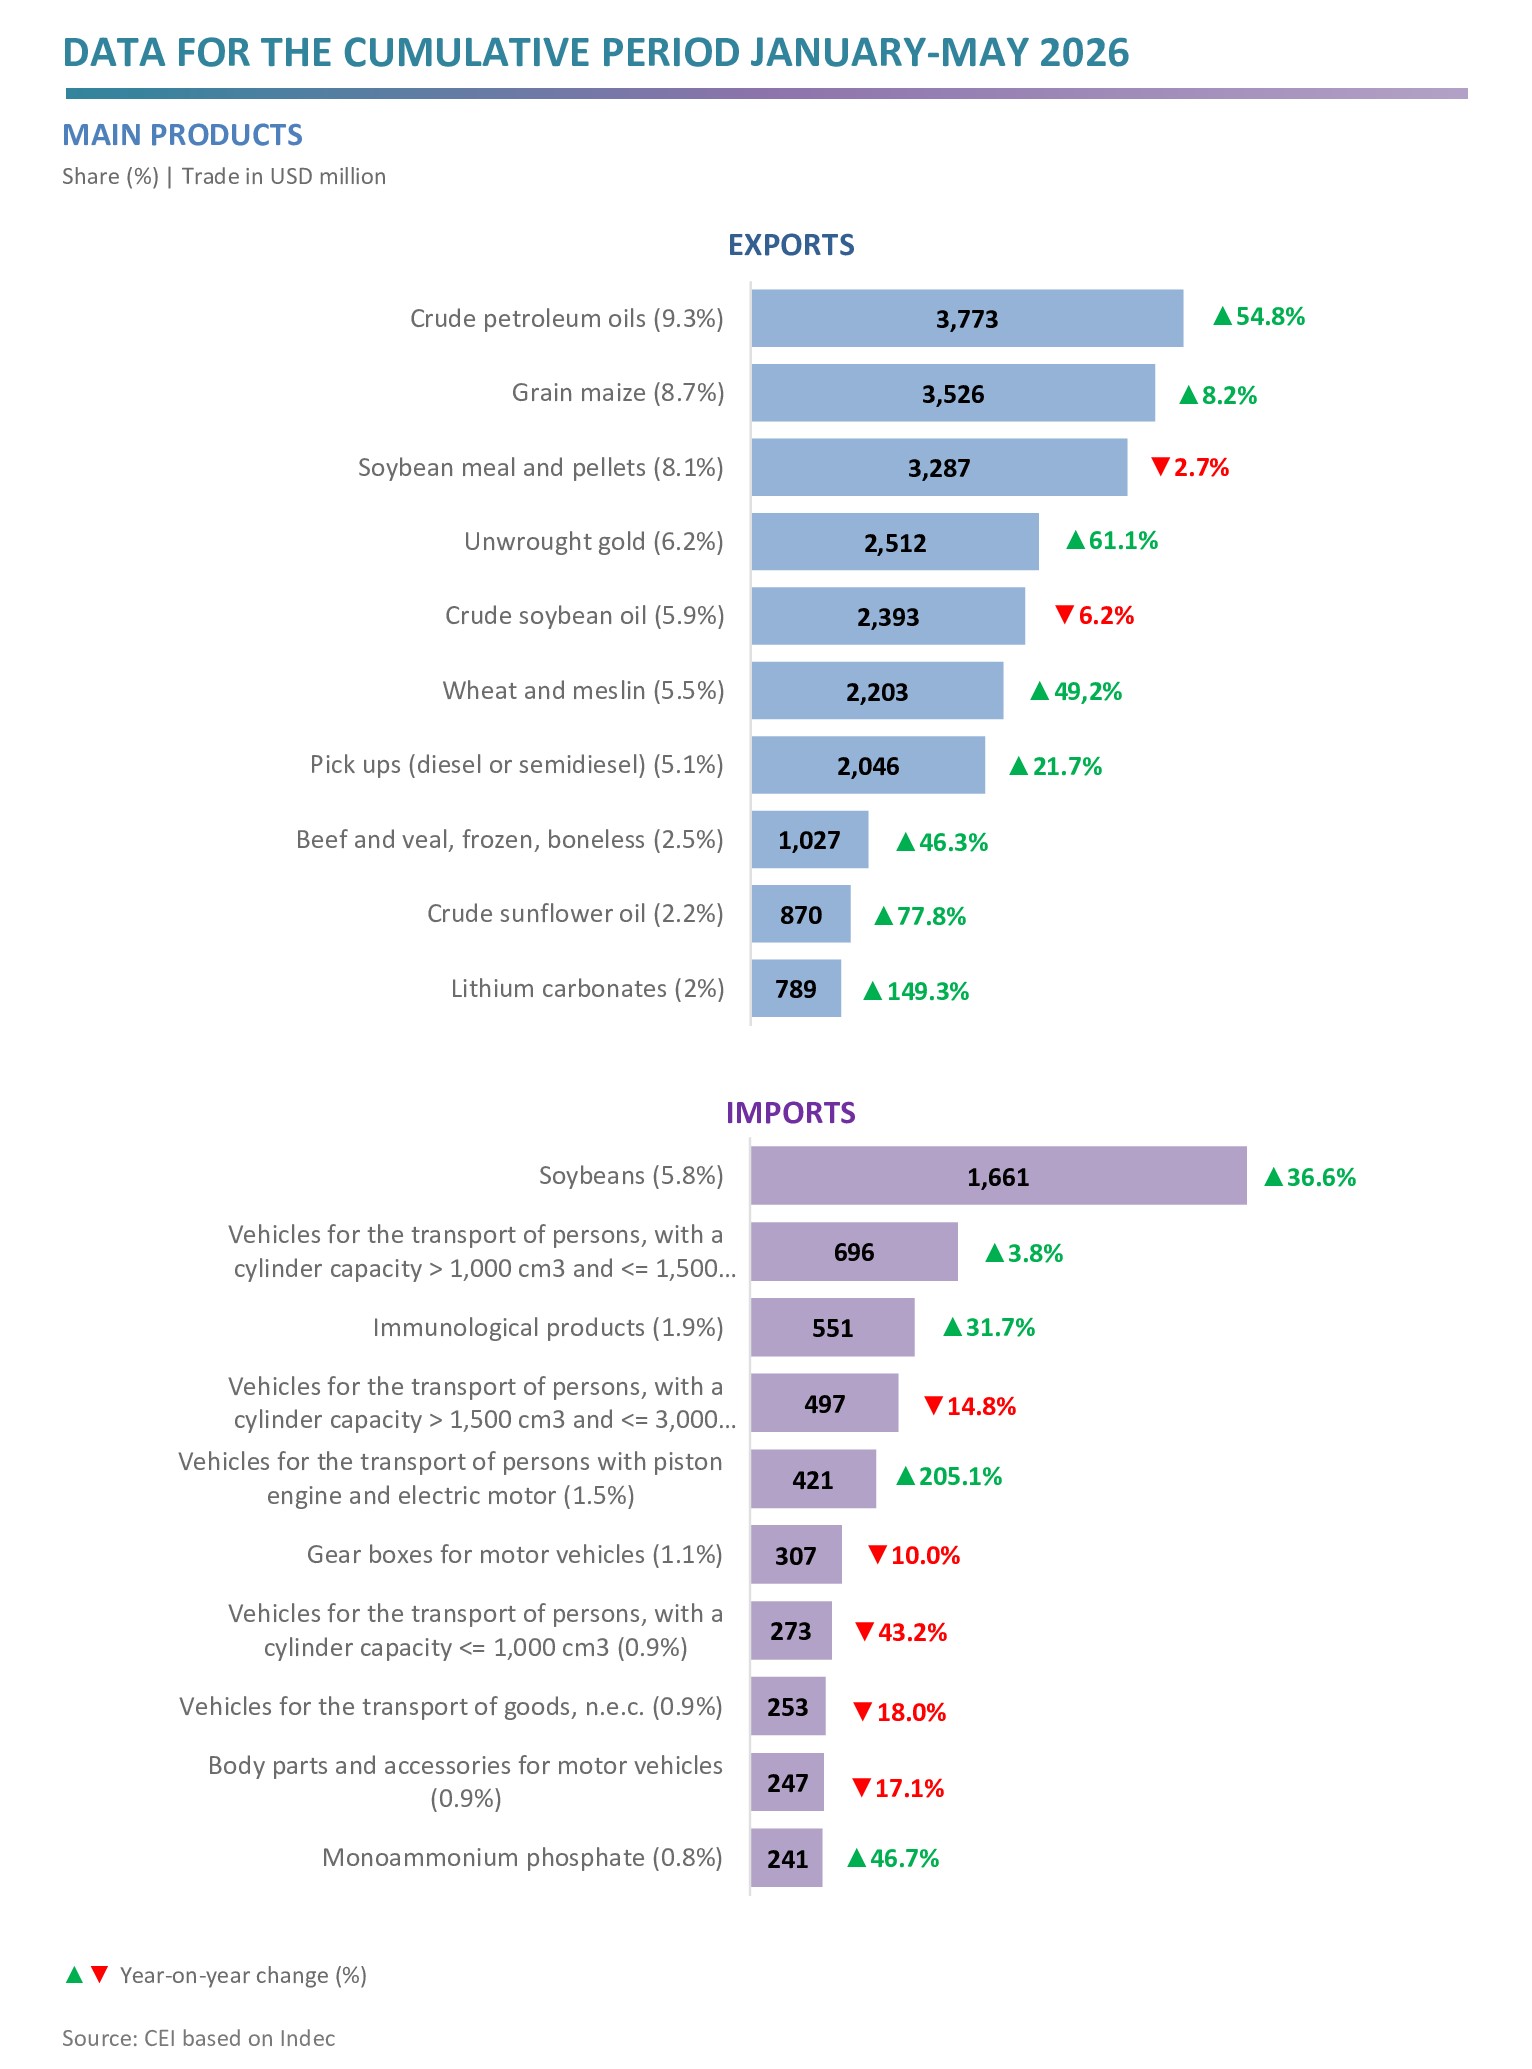
- Notable increases were seen in exports of crude petroleum oils (USD 1.3 billion), unwrought gold (USD 952 million) and wheat (USD 727 million); while the sharpest falls were observed in sales of passenger vehicles (-USD 171 million), soybean oil (-USD 157 million) and soybean flour and pellets (-USD 91 million).
- In the soybean complex, soybean prices fell (2.2%), whereas those for crude oil (9.5%) and flour and pellets (1.5%) increased. In terms of export volumes, those of crude oil (-14.3%) and flour and pellets (-4.1%) fell, whilst those of soybeans rose (24.8%).
- As for imports, the most significant drops were in purchases of chassis, parts and tyres (-USD 685 million), gas oil (-USD 390 million), telephone parts (-USD 332 million) and road tractors for semi-trailers (-USD 173 million); while those of soybeans (USD 445 million), vehicles for the transport of persons (USD 223 million) and smartphones (USD 171 million) increased.
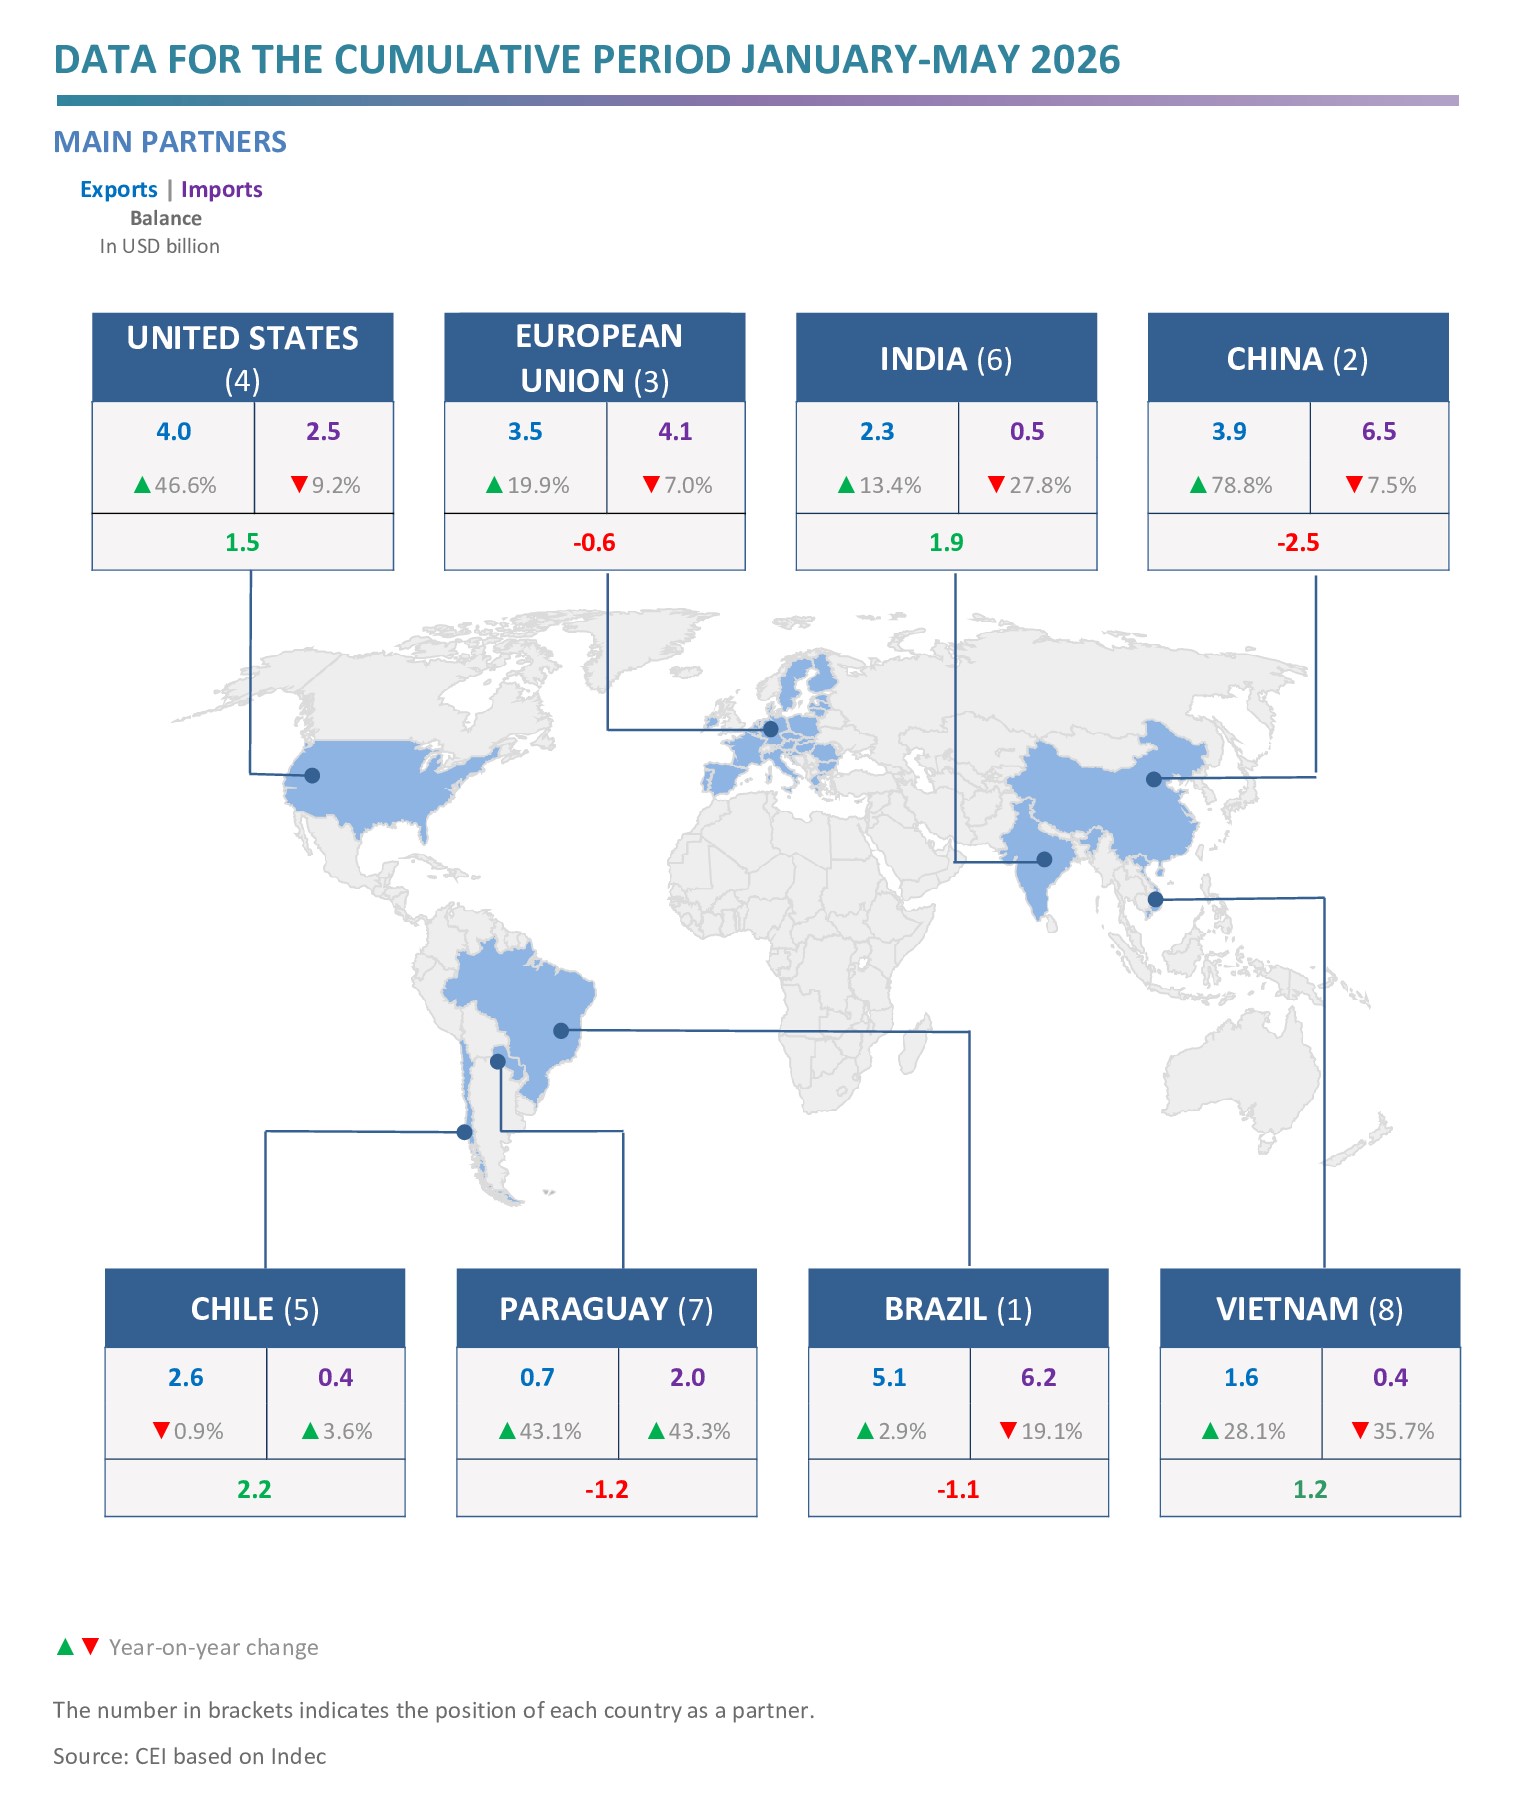
- The main export destinations were Brazil, with a 12.6% share, the United States (9.9%), China (9.8%) and the EU (8.8%). Meanwhile, the most significant sources of imports were China, which accounted for 22.7% of the total, Brazil (21.6%), the EU (14.4%) and the United States (8.6%).
- The largest trade surpluses were recorded with Chile (USD 2.2 billion), India (USD 1.9 billion), the United States (USD 1.5 billion), Vietnam (USD 1.2 billion) and Peru (USD 1.0 billion); in turn, the largest deficits were recorded with China (-USD 2.5 billion), Paraguay (USD 1.2 billion) and Brazil (USD 1.1 billion).
Documentos relacionados:

Galería: