Tuesday, 21 October 2025
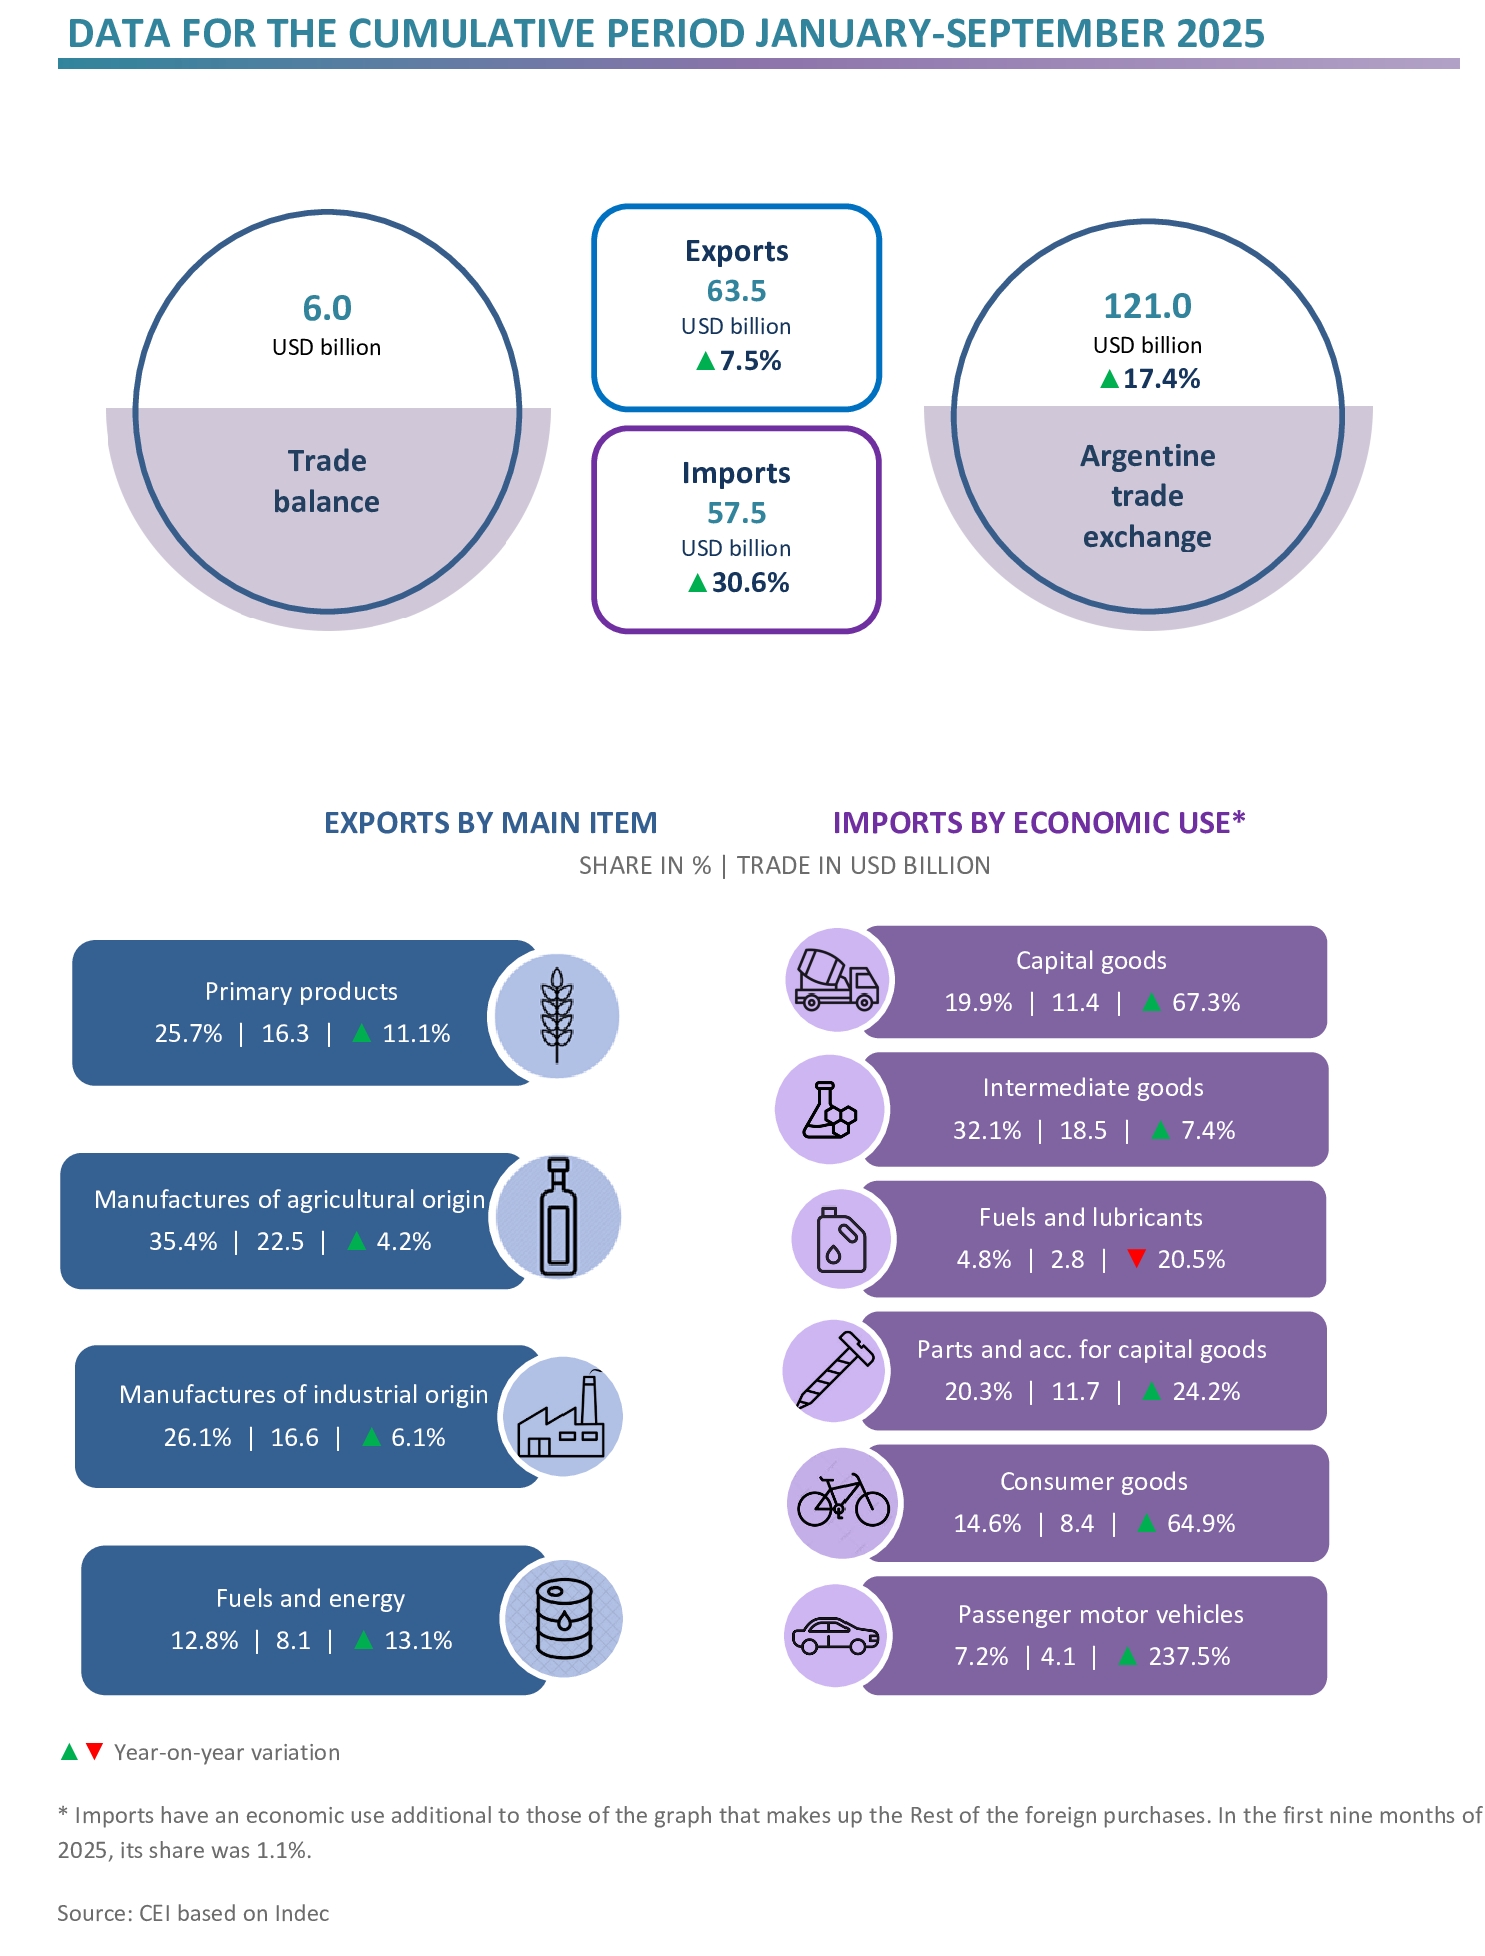
In the first nine months of 2025, exports reached USD 63.5 billion (a 7.5% increase compared to the same period in 2024) and imports totalled USD 57.5 billion (a 30.6% year-on-year rise). As a result, a trade surplus of USD 6.0 billion was achieved.
HIGHLIGHTS
- Between January and September 2025, exports amounted to USD 63.5 billion, representing a 7.5% year-on-year increase, as a result of a rise in the exported quantities (7.8%) that more than offset the decrease in prices (‑0.3%).
- Imports reached USD 57.5 billion and grew 30.6% year-on-year, owing to the 38.6% rise in the imported quantities, while prices dropped 5.8%. This is mainly due to higher quantities of passenger motor vehicles, capital goods, consumer goods and parts and accessories for capital goods.
- Consequently, the trade balance achieved a surplus of USD 6.0 billion, whereas in the January-September 2024 cumulative period, a positive balance of USD 15.1 billion had been recorded.

- Prominent were the increases in exports of soybeans (USD 1.1 billion), crude soybean oil (USD 1.1 billion), crude petroleum oils (USD 847 million) and unwrought gold (USD 802 million); while the largest drops occurred in soybean flour and pellets (-USD 1.5 billion), motor vehicles for the transport of persons (-USD 299 million) and frozen shrimp and prawns (-USD 185 million).
- In relation to the soybean complex, the prices of flour and pellets (‑22.0%) and beans (‑9.1%) decreased, while those of crude oil (14.3%) increased. As for the quantities exported, rises were recorded in those of beans (74.8%), crude oil (13.0%), and flour and pellets (4.3%).
- Regarding imports, the most significant increases occurred in the purchases of vehicles for the transport of persons (USD 2.3 billion), chassis, parts and tyres (USD 1.3 billion), vehicles for the transport of goods (USD 739 million), and telephone parts (USD 374 million); while those of soybeans (‑USD 664 million), natural gas in gaseous state (‑USD 534 million), and gas oil (‑USD 245 million) fell.

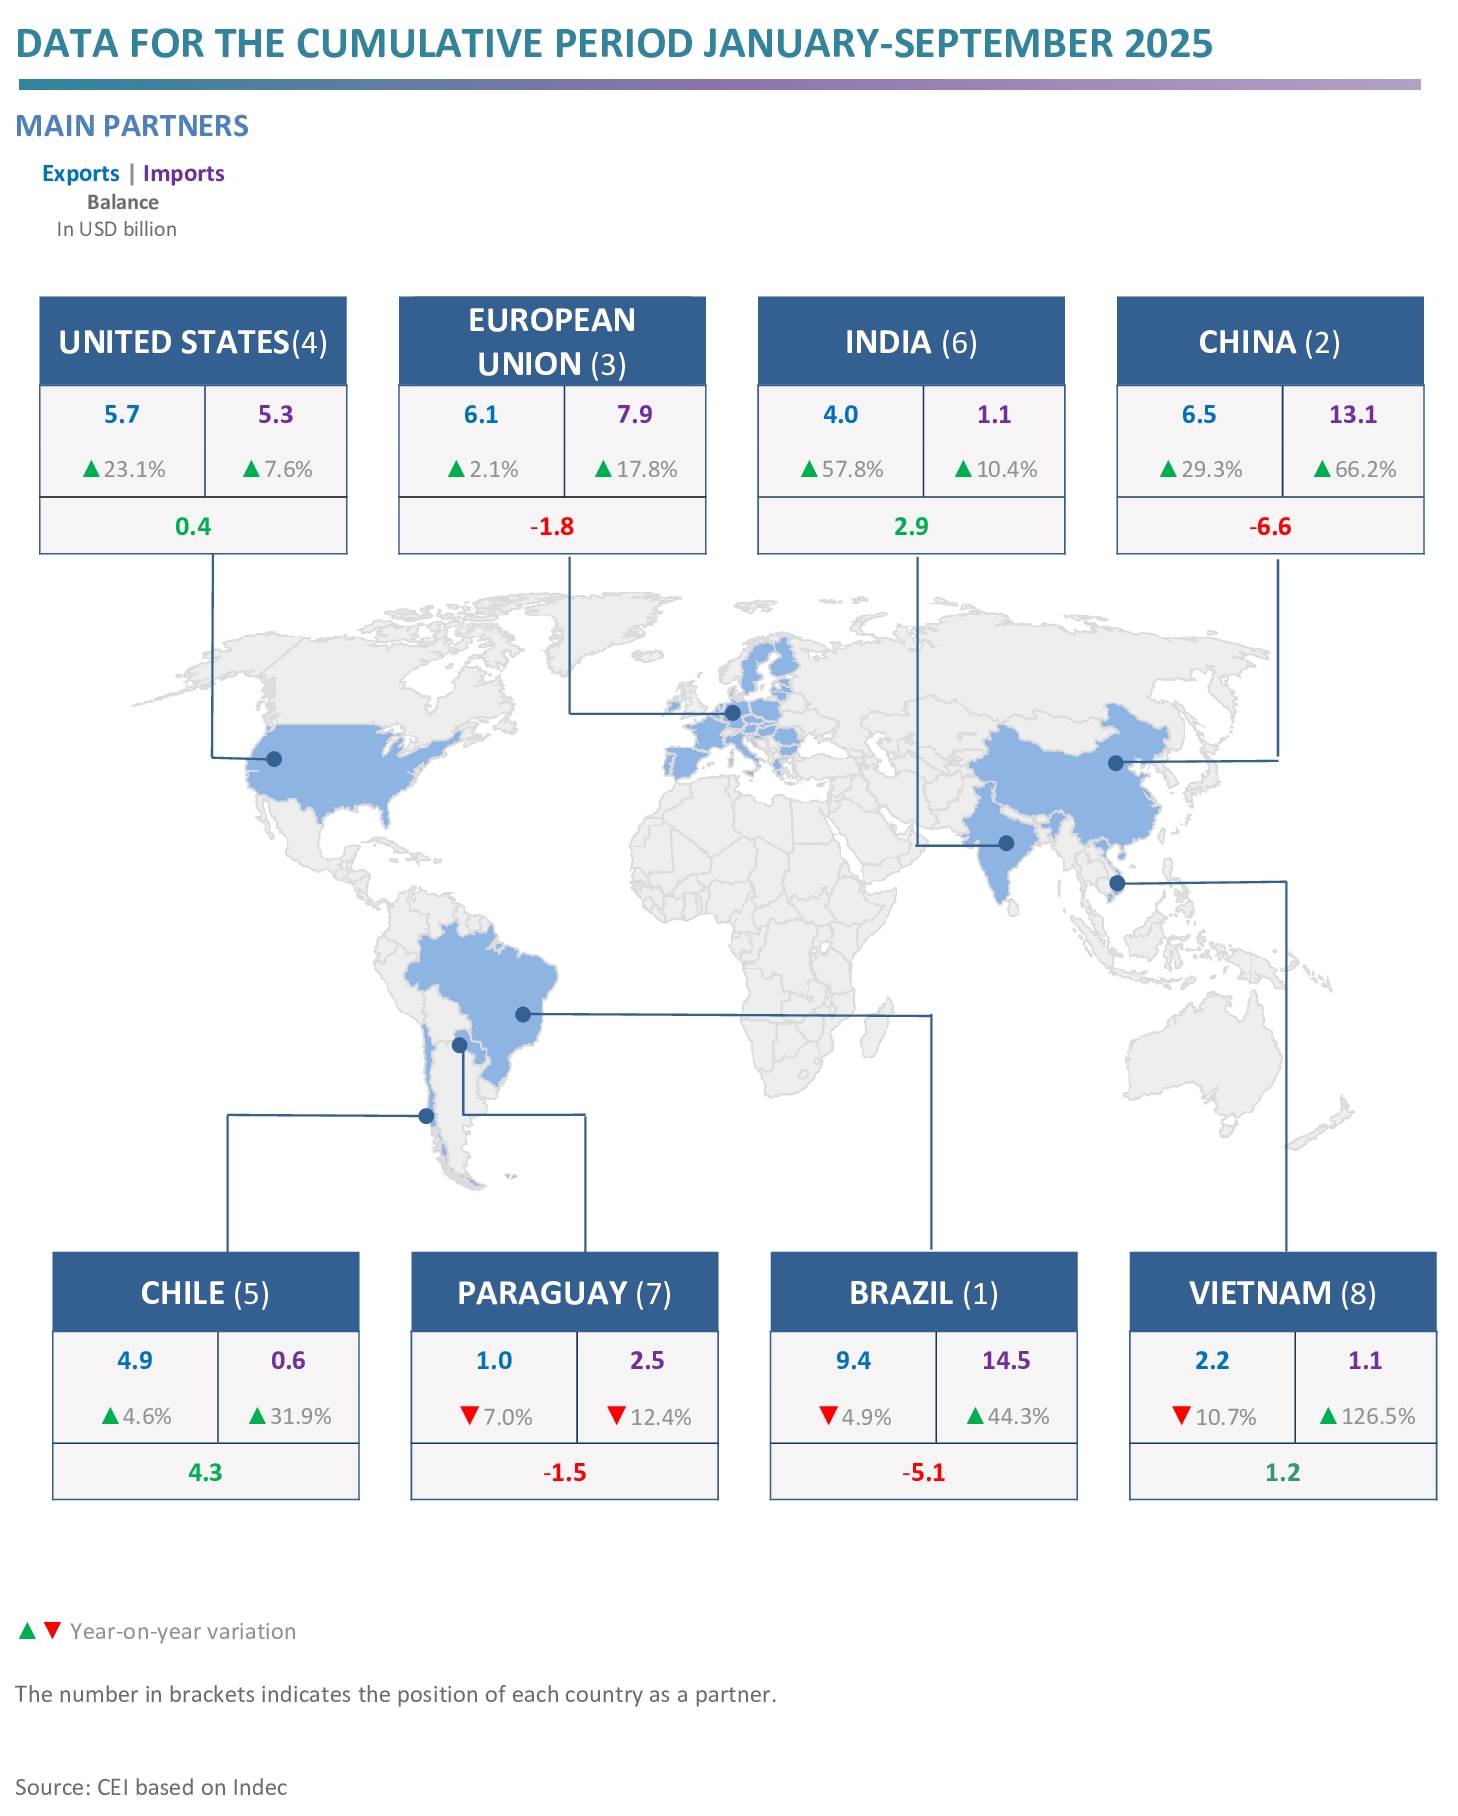
- The main export destinations were Brazil, with a 14.7% share; China, 10.3%; the EU, 9.5% and the United States, 9.0%. In turn, the most outstanding origins of imports were: Brazil, with 25.2% of the total, China, 22.8%, the EU, 13.7%, and the United States, 9.2%.
- The largest surpluses were obtained in trade with Chile (USD 4.3 billion), India (USD 2.9 billion), Peru (USD 1.6 billion), Vietnam (USD 1.2 billion) and the Netherlands (USD 1.1 billion); whereas the main deficits were registered with China (‑USD 6.6 billion), Brazil (‑USD 5.1 billion) and Germany (‑USD 1.6 billion).

The full report in Spanish is available here (with highlights in English).
Documentos relacionados:
Galería: