Wednesday, 21 January 2026
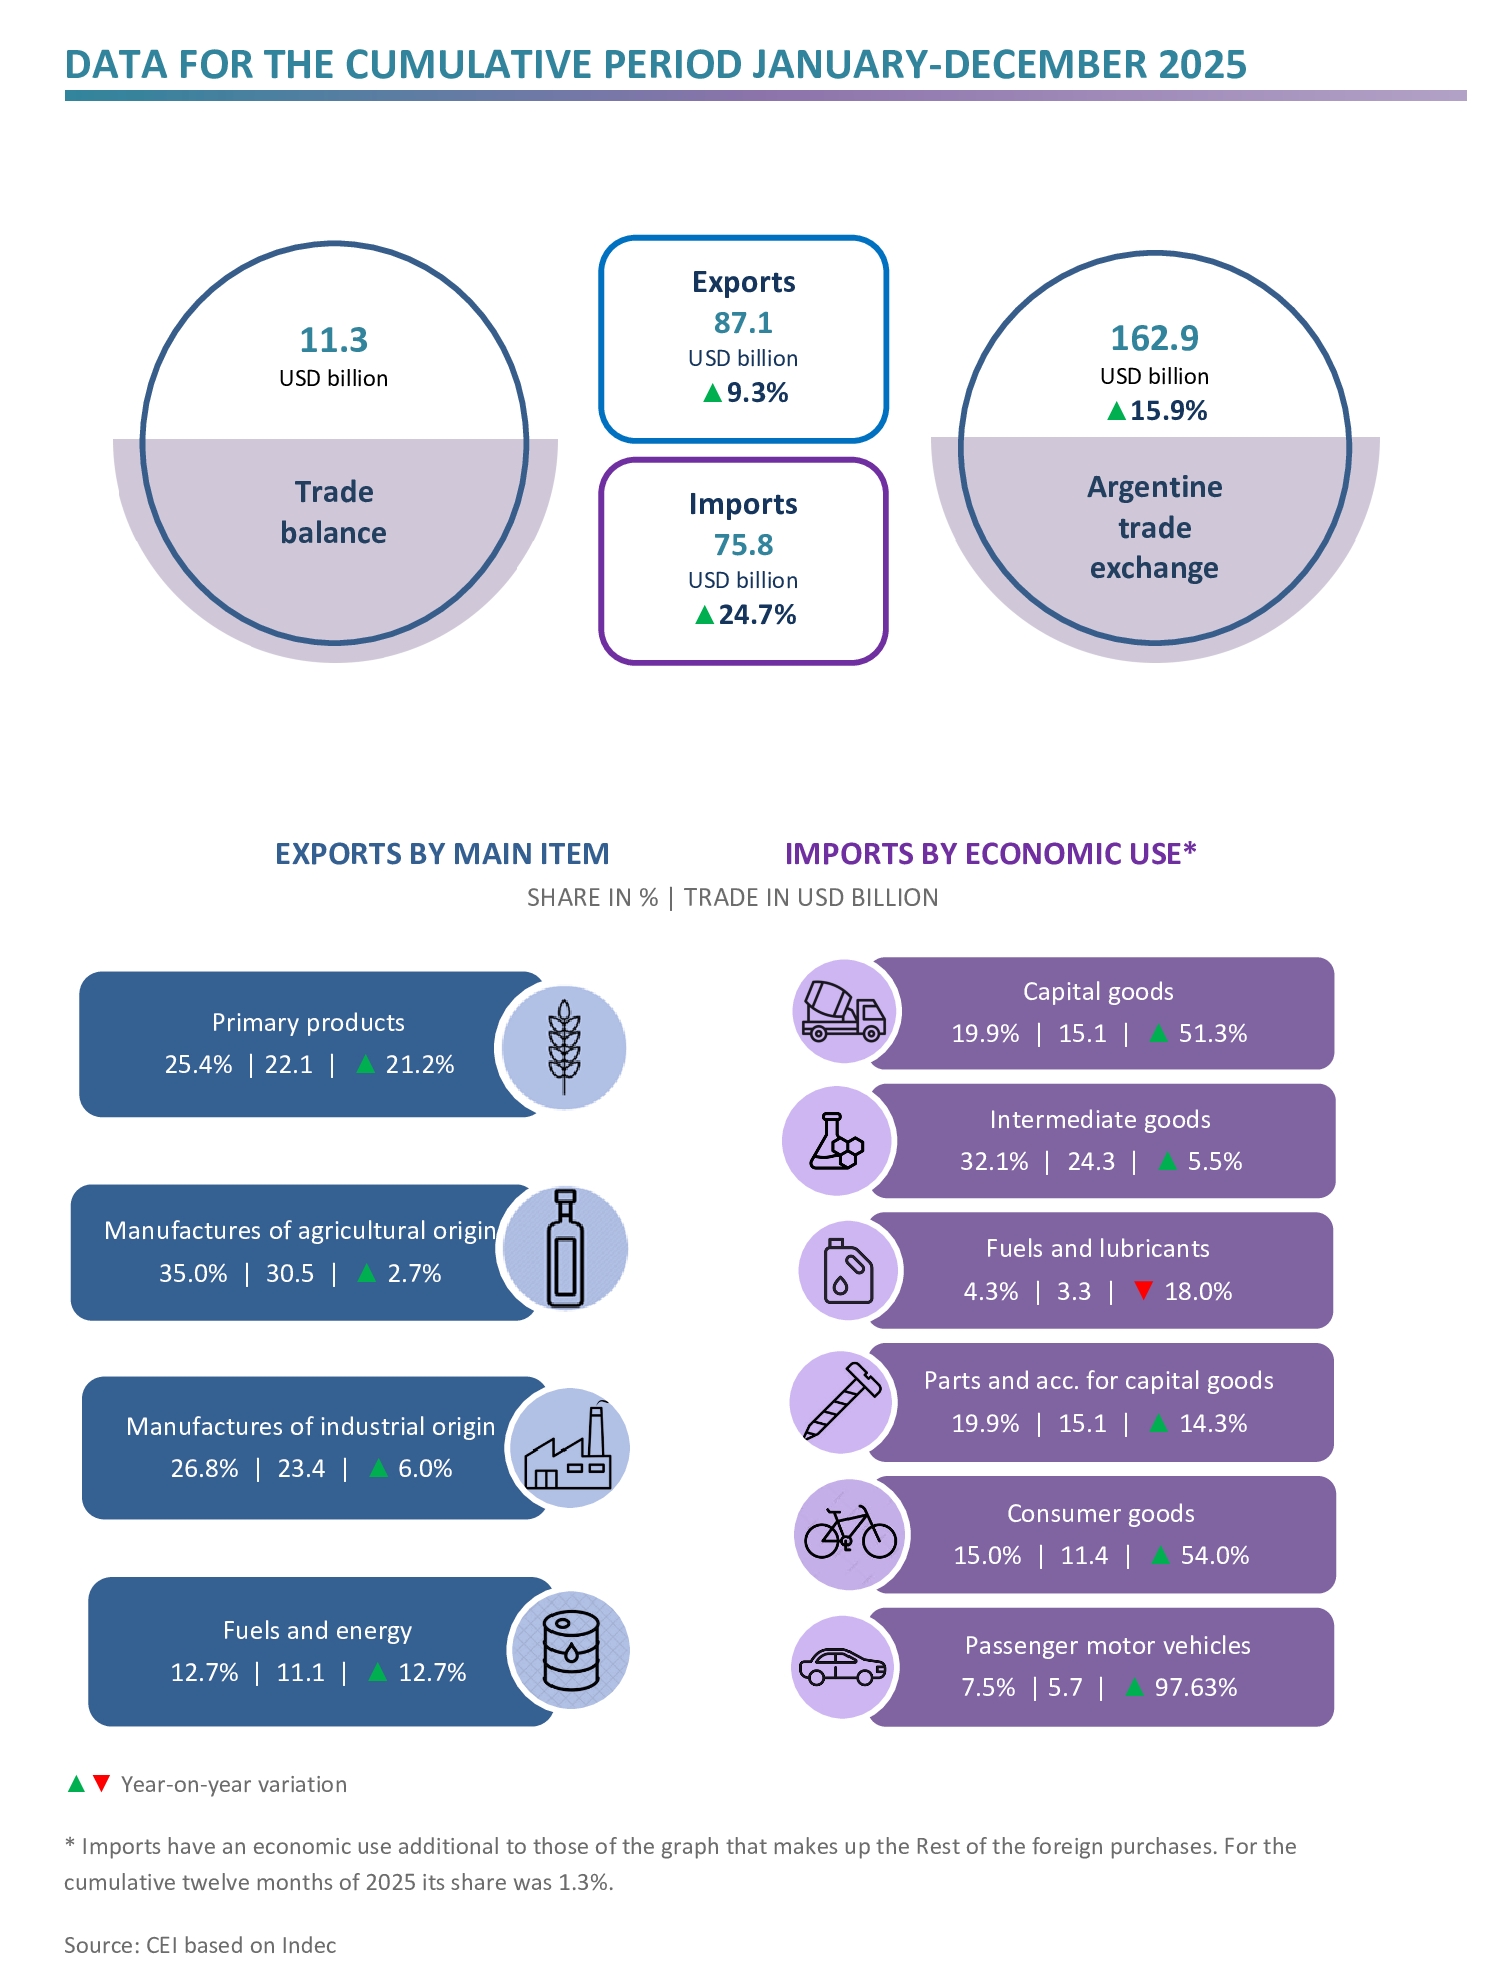
Between January and December 2025, Argentine exports reached USD 87.1 billion (a 9.3% increase compared to 2024), while imports totalled USD 75.8 billion (a 24.7% year-on-year rise). As a result, a trade surplus of USD 11.3 billion was recorded.
HIGHLIGHTS
- In the twelve months of 2025, exports totalled USD 87.1 billion, representing a 9.3% year-on-year increase, as a result of a rise in the exported quantities (10.0%) that more than offset the decrease in prices (-0.6%).
- Imports amounted to USD 75.8 billion and grew 24.7% year-on-year, owing to the 30.5% rise in the imported quantities, while prices dropped 4.5%. This is mainly due to higher quantities of passenger motor vehicles, consumer goods, and capital goods and their parts and accessories.
- Consequently, the trade balance reached a surplus of USD 11.3 billion, when in January-December 2024 a positive balance of USD 18.9 billion had been recorded.

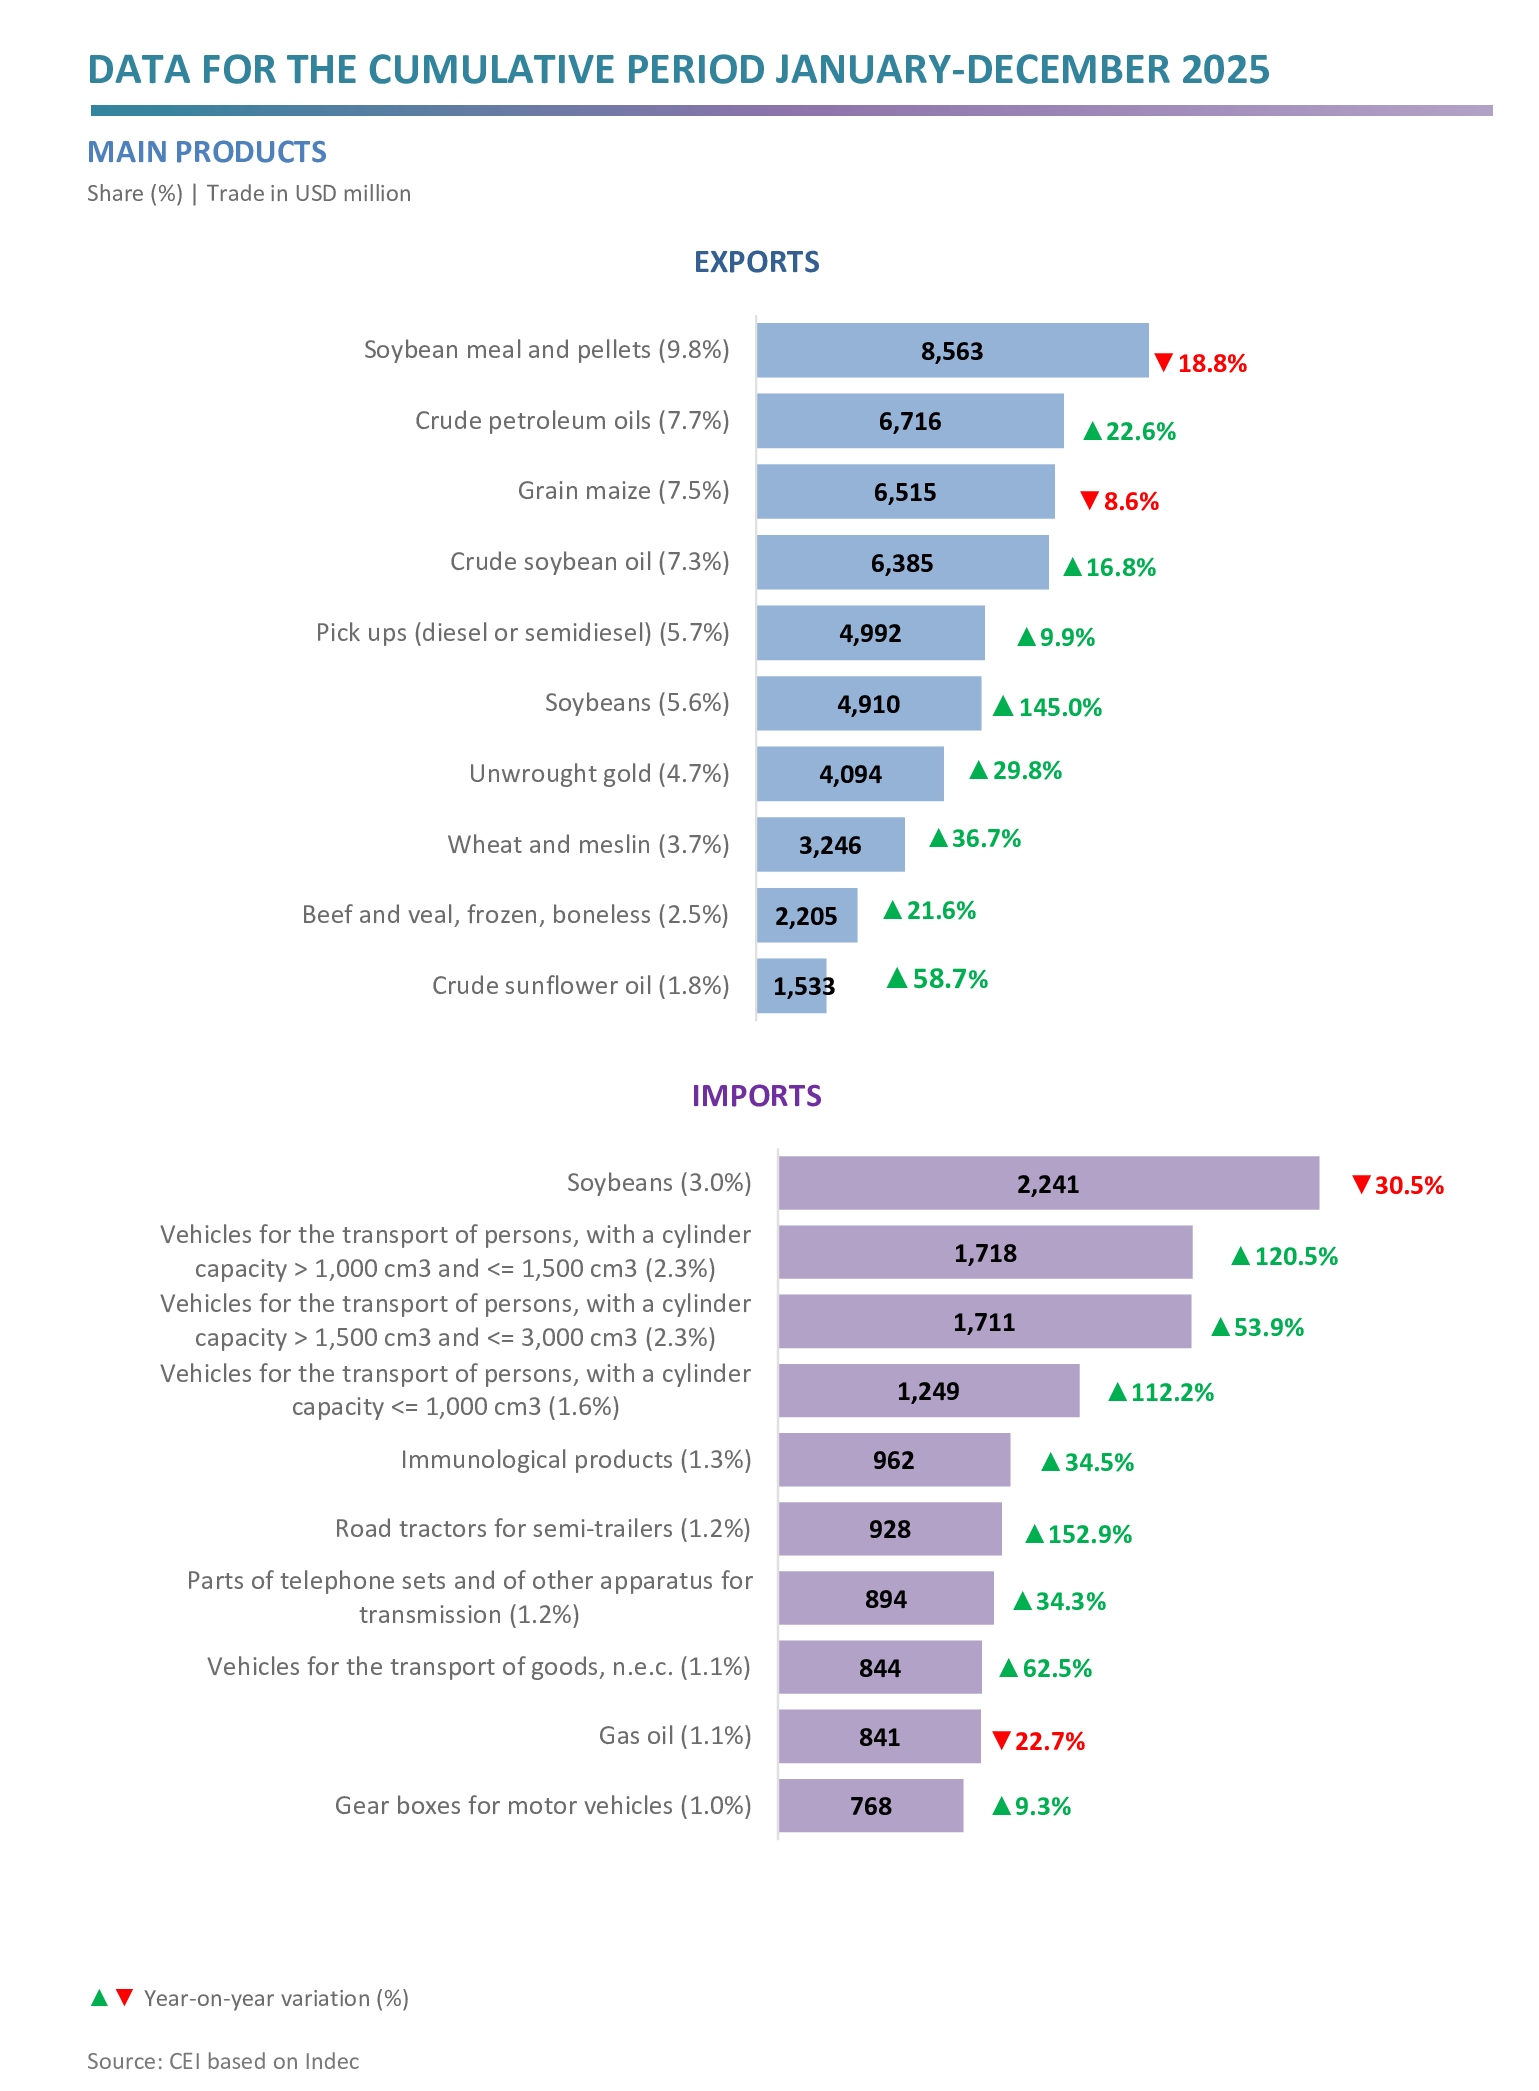
- Prominent is the increase in exports of soybeans (USD 2.9 billion), crude petroleum oils (USD 1.2 billion), unwrought gold (USD 939 million) and crude soybean oil (USD 921 million); while the largest drops occurred in soybean flour and pellets (-USD 2.0 billion), motor vehicles for the transport of persons (-USD 724 million) and grain maize (-USD 613 million).
- In relation to the soybean complex, the prices of flour and pellets (‑20.6%) and beans (‑8.7%) dropped, while those of crude oil (9.8%) rose. As for the quantities exported, rises were recorded in those of beans (168.5%), crude oil (6.4%), and flour and pellets (2.2%).
- Regarding imports, the most significant increases occurred in the purchases of vehicles for the transport of persons (USD 2.9 billion), chassis, parts and tyres (USD 1.0 billion), vehicles for the transport of goods (USD 817 million), and telephone parts (USD 228 million); while those of soybeans (‑USD 984 million), natural gas in gaseous state (‑USD 571 million), and gas oil (‑USD 247 million) fell.

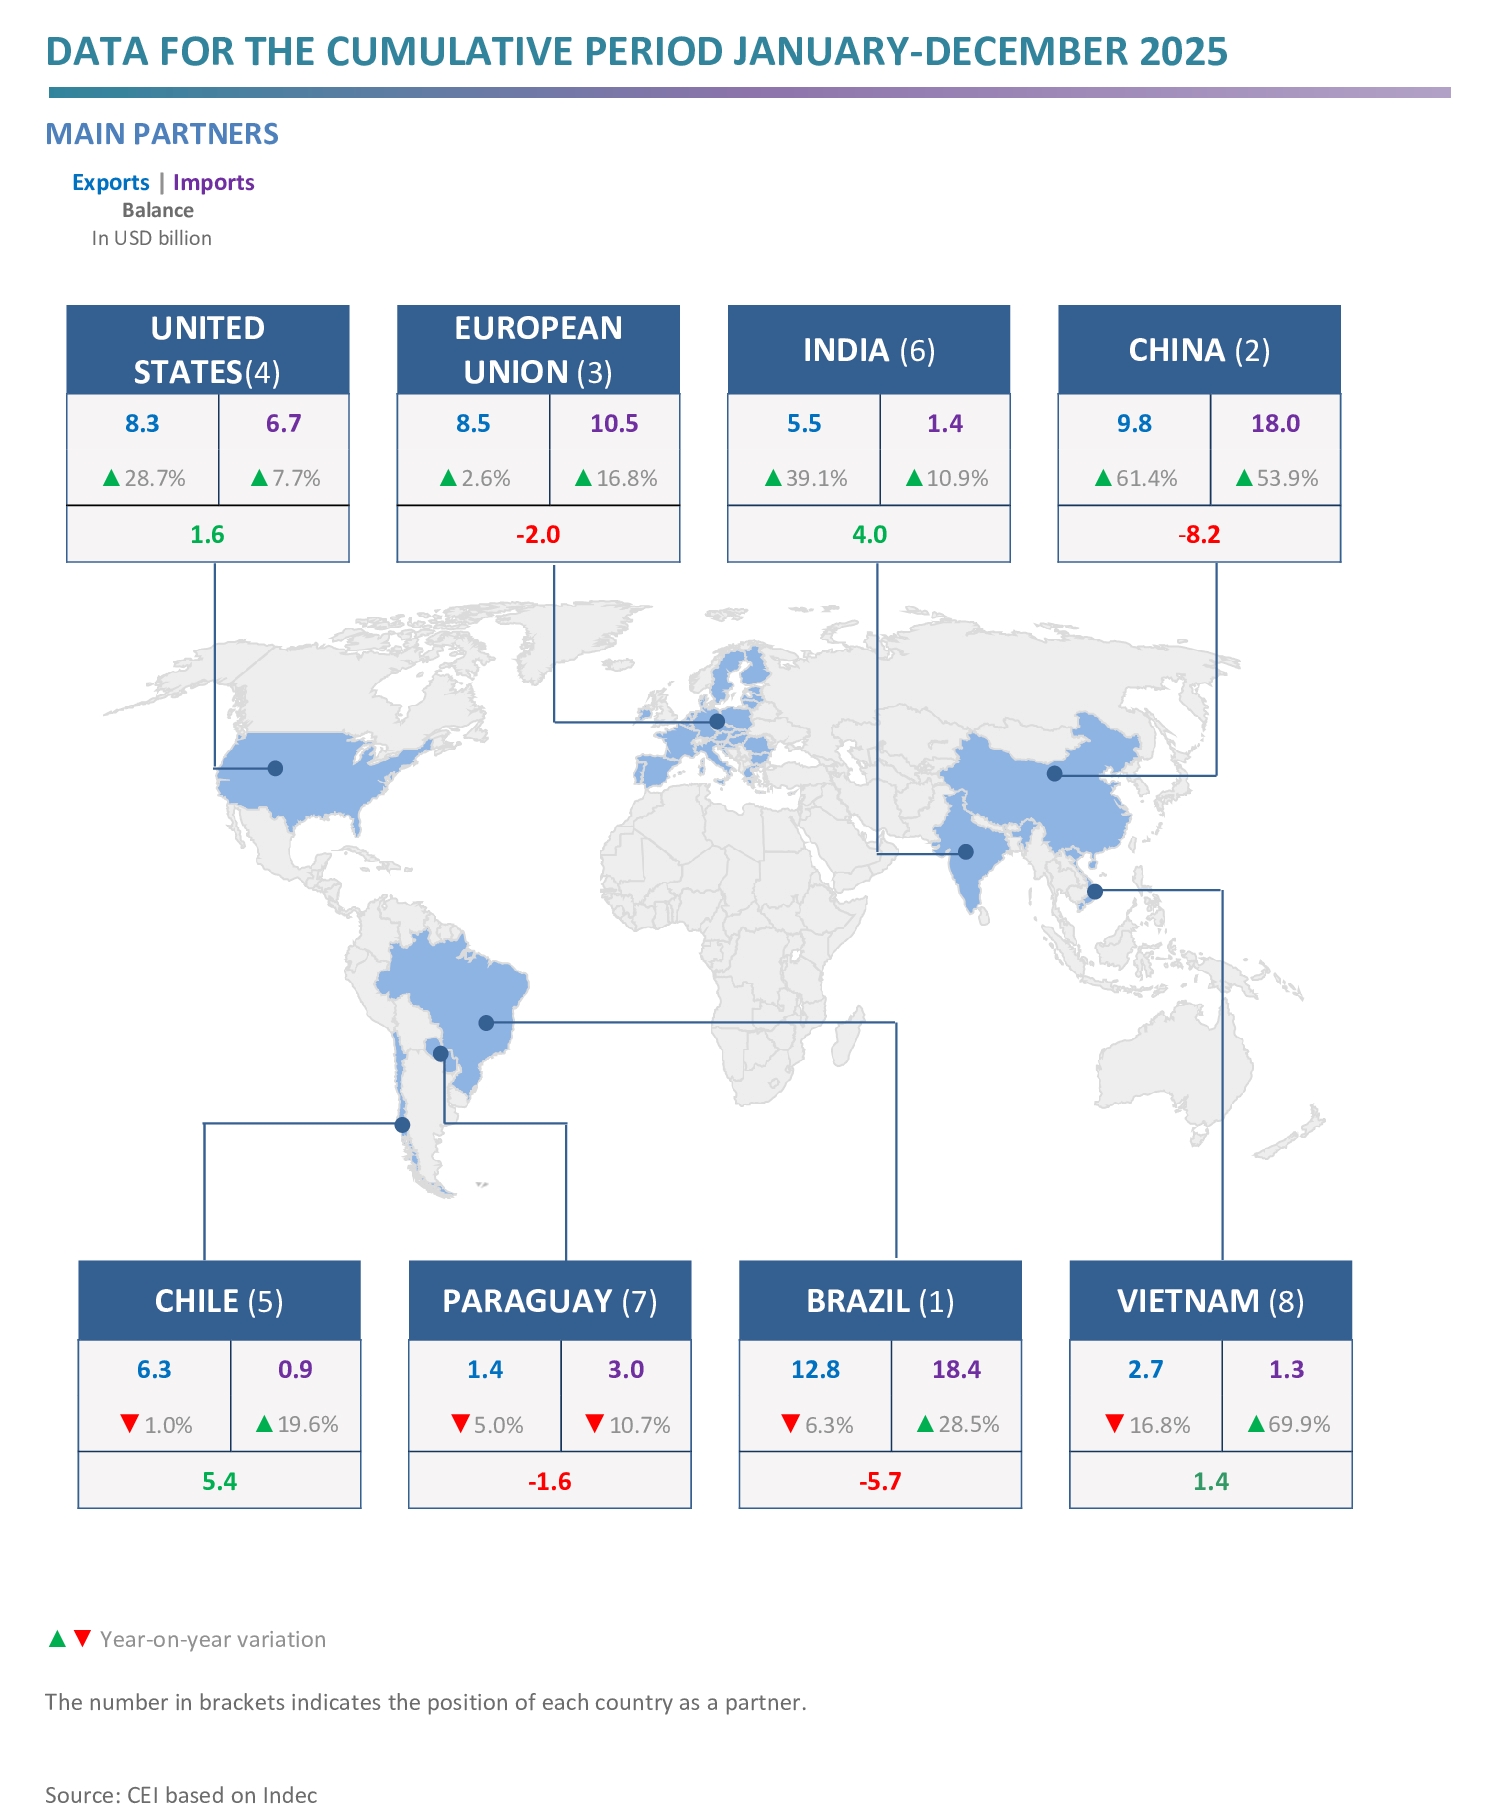
- The main export destinations were Brazil, with a 14.7% share; China, with 11.3%, the EU, with 9.7%, and the United States, with 9.6%. In turn, the most prominent origins of imports were Brazil, 24.3% of the total, China, 23.7%, the EU, 13.8%, and the United States, 8.8%.
- The largest surpluses were obtained in trade with Chile (USD 5.4 billion), India (USD 4.0 billion), Peru (USD 2.2 billion), the United States (USD 1.6 billion) and the Netherlands (USD 1.6 billion); while the main deficits were registered with China (‑USD 8.2 billion), Brazil (‑USD 5.7 billion) and Germany (‑USD 2.0 billion).

The full report in Spanish is available here (with highlights in English).
Documentos relacionados:
Galería: