Wednesday, 19 June 2024
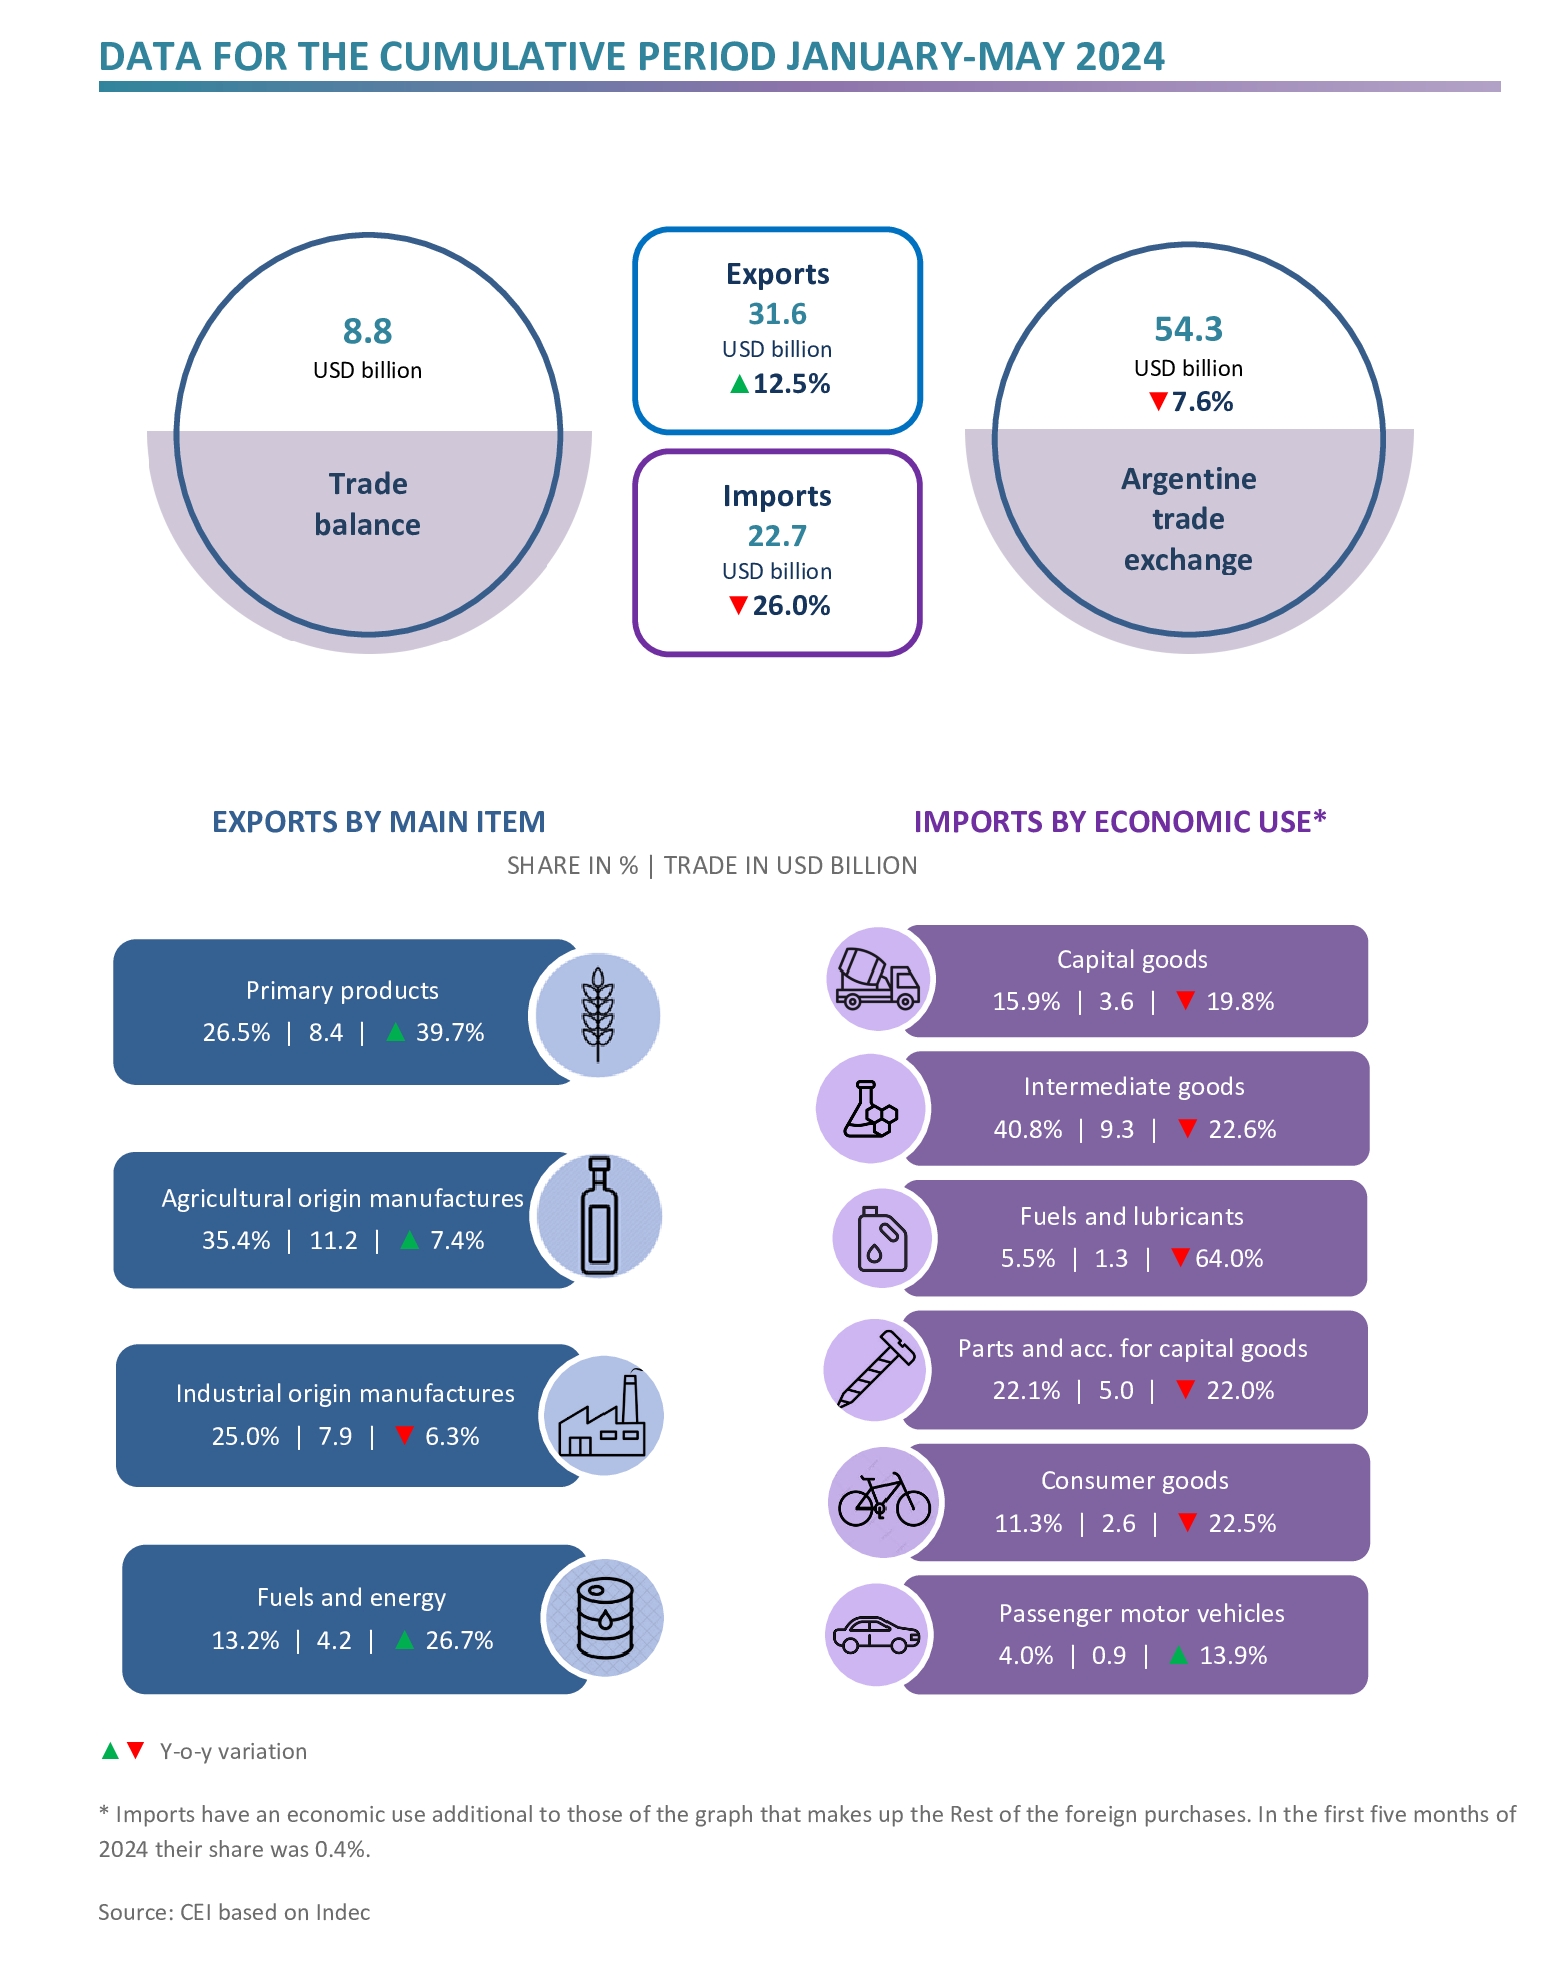
In the first five months of 2024, exports totalled USD 31.6 billion (a 12.5% y-o-y rise), while imports amounted to USD 22.7 billion (a 26.0% y-o-y decrease). This resulted in a trade surplus of USD 8.8 billion.
Highlights
- In the January-May 2024 period, exports reached USD 31.6 billion, representing a 12.5% year-on-year rise, accounted for by a 22.2% increase in the quantities exported. This outweighed the 8.0% drop in prices.
- Imports amounted to USD 22.8 billion and fell 26.0% year-on-year, as a result of decreases of 5.9% and 21.3% in prices and quantities imported, respectively. This was mainly due to lower prices of intermediate goods and decreases in the quantities of fuels and lubricants, and, to a lesser extent, of parts and accessories for capital goods, consumer goods and capital goods. On the other hand, the imports of motor vehicles increased, due to an increase in quantities that greatly exceeded the slight drop in prices.
- As a result, the trade balance reached an USD 8.8 billion surplus, when in the first five months of 2023 a USD 2.7 billion deficit had been recorded.

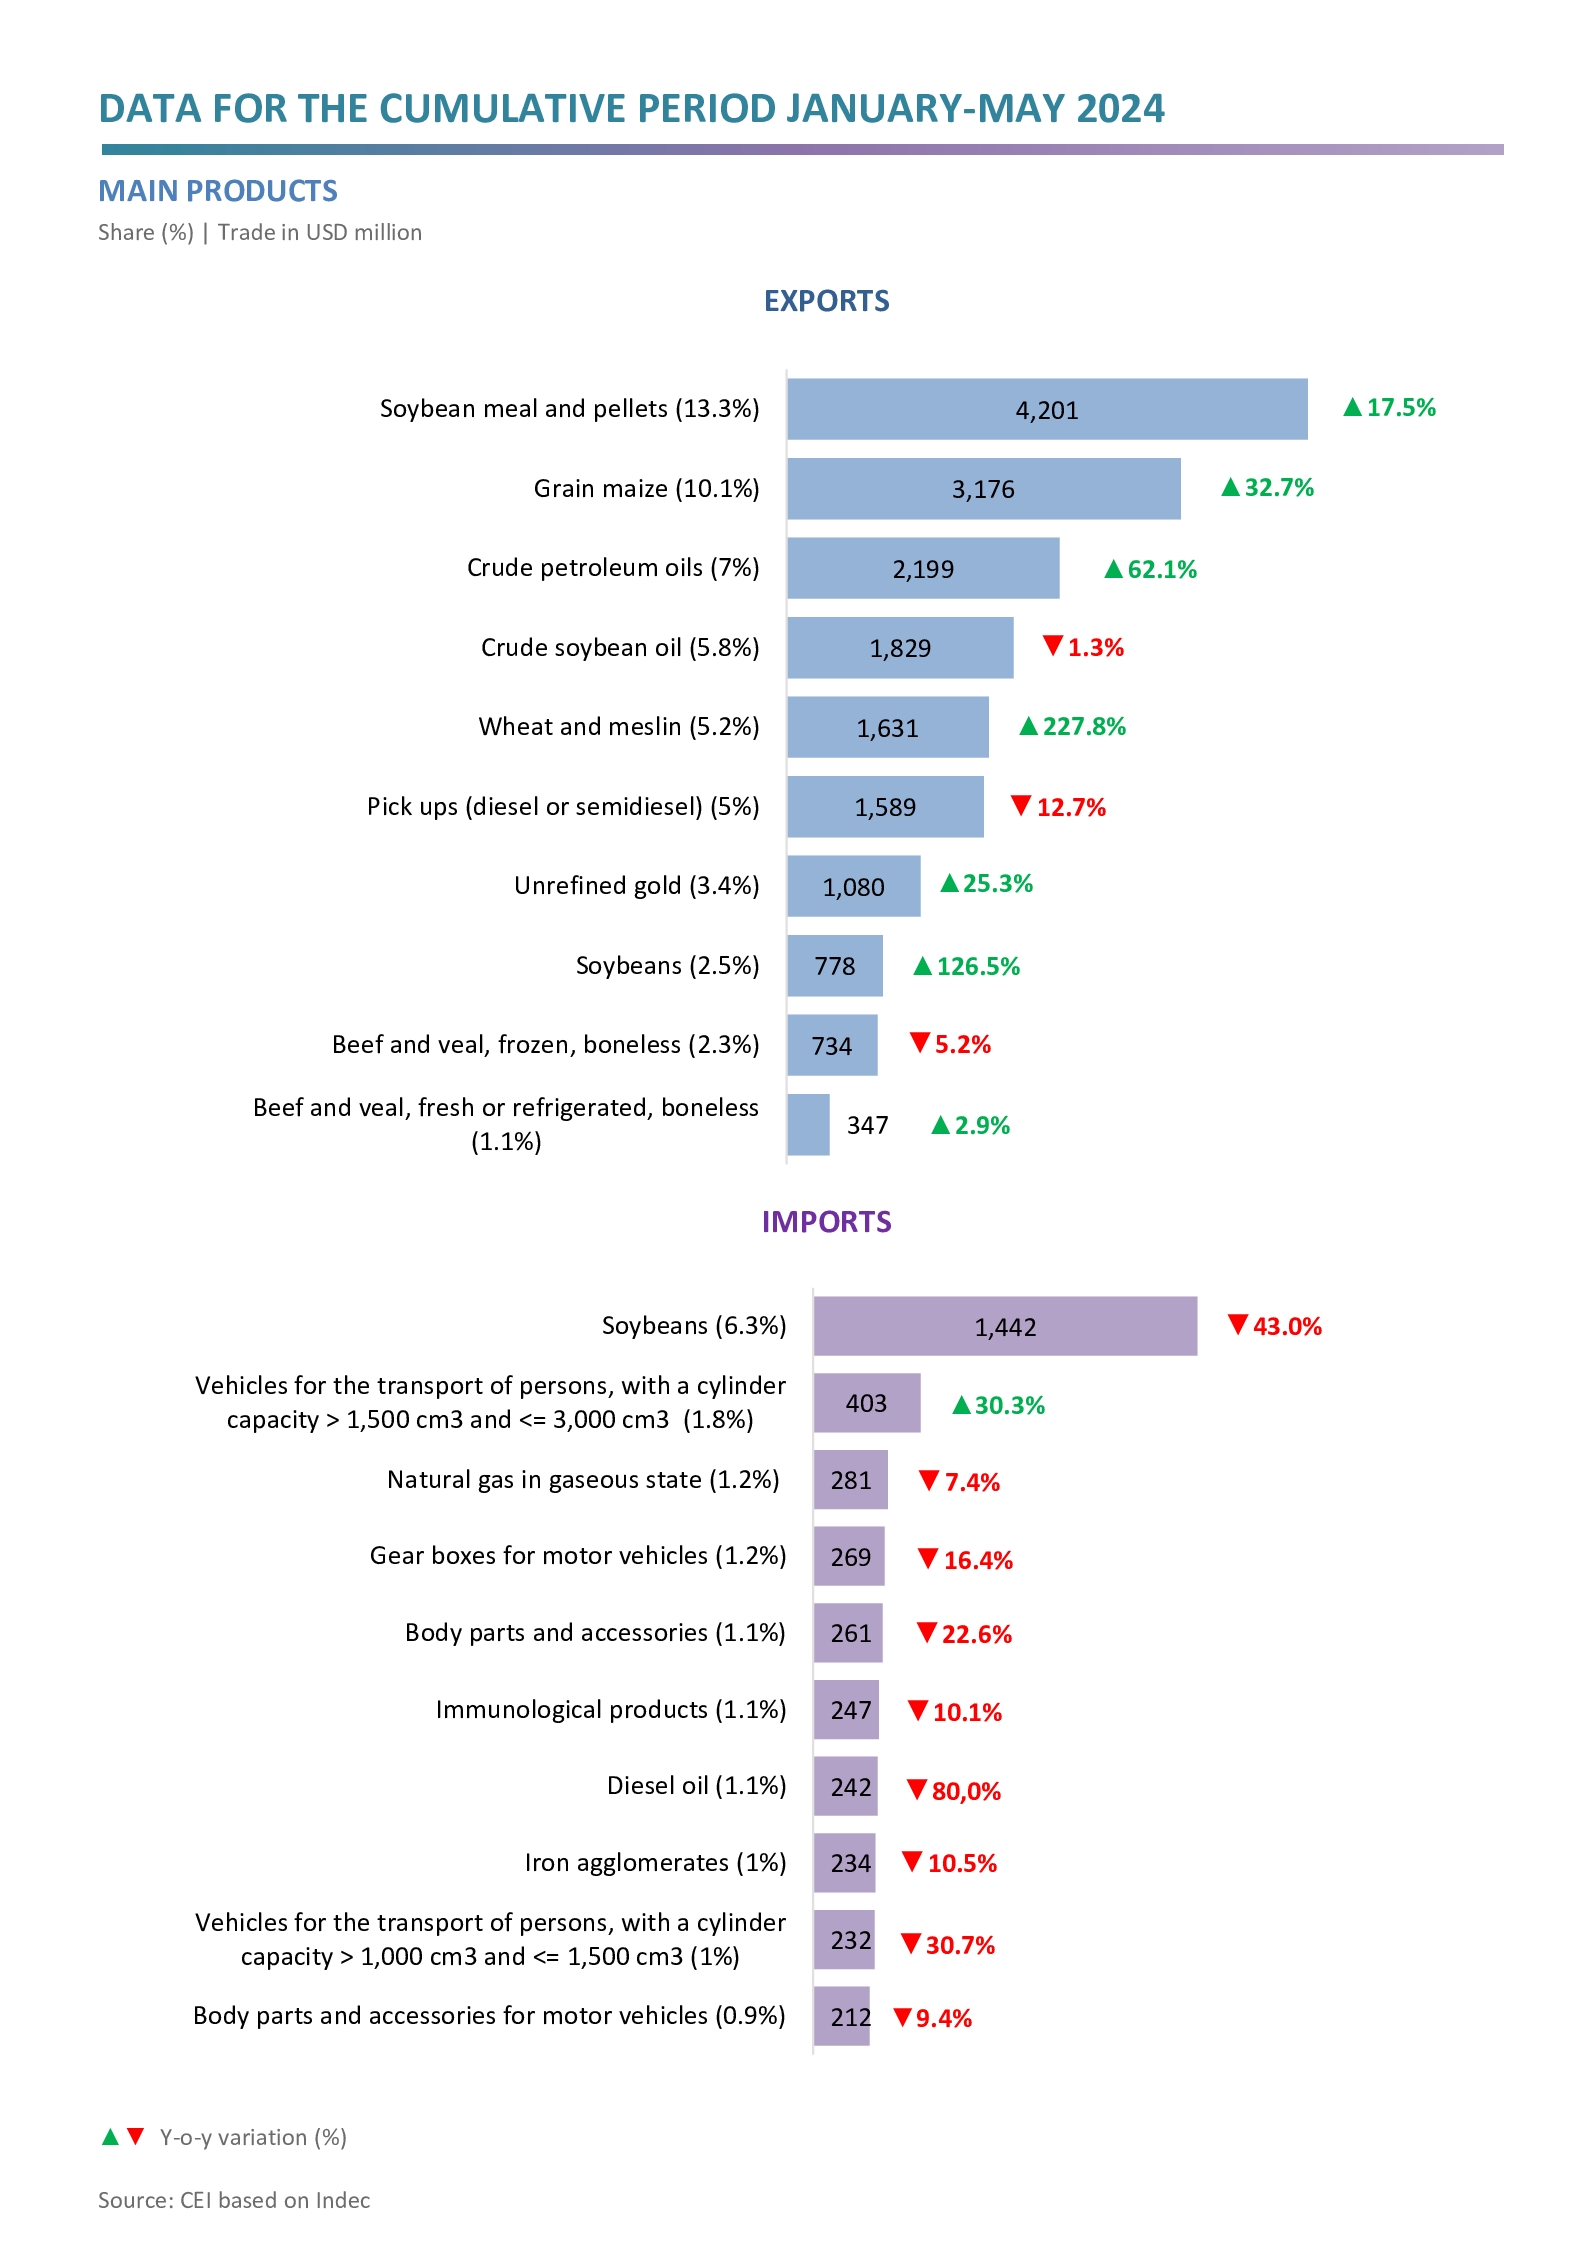
- Increases in the exports of wheat (USD 1,049 million, mainly to Brazil and Indonesia), crude petroleum oils (USD 634 million), corn (USD 574 million), and soybean meal and pellets (USD 519 million) stand out. Although with lower absolute growth, there were also higher sales of deboned beef, both frozen (mainly to China) and fresh or refrigerated (to Germany). On the other hand, the most significant drops were in the exports of vehicles for the transportation of goods (-USD 236 million), raw silver (-USD 111 million), natural gas in gaseous form (-USD 111 million) and biodiesel (-USD 104 million).
- In relation to the soybean complex, the prices of beans (-36.3%), biodiesel (-28.6%), crude oil (-26.7%) and meal and pellets (-17.3%) went down. As for the quantities exported, soybeans (362.9%), meal and pellets (45.7%), and crude oil (34.6%) increased, while biodiesel (-49.3%) decreased.
- Regarding imports, the most important decreases were in diesel oil (-USD 881 million), soy beans (-USD 720 million) and parts of telephones and broadcasting, transmission or reception apparatuses (-USD 573 million); while imports of vehicles for transporting people with a cylinder capacity >1500 cm3 and <=3000 cm3 (USD 114 million) and urea (USD 79 million) increased.

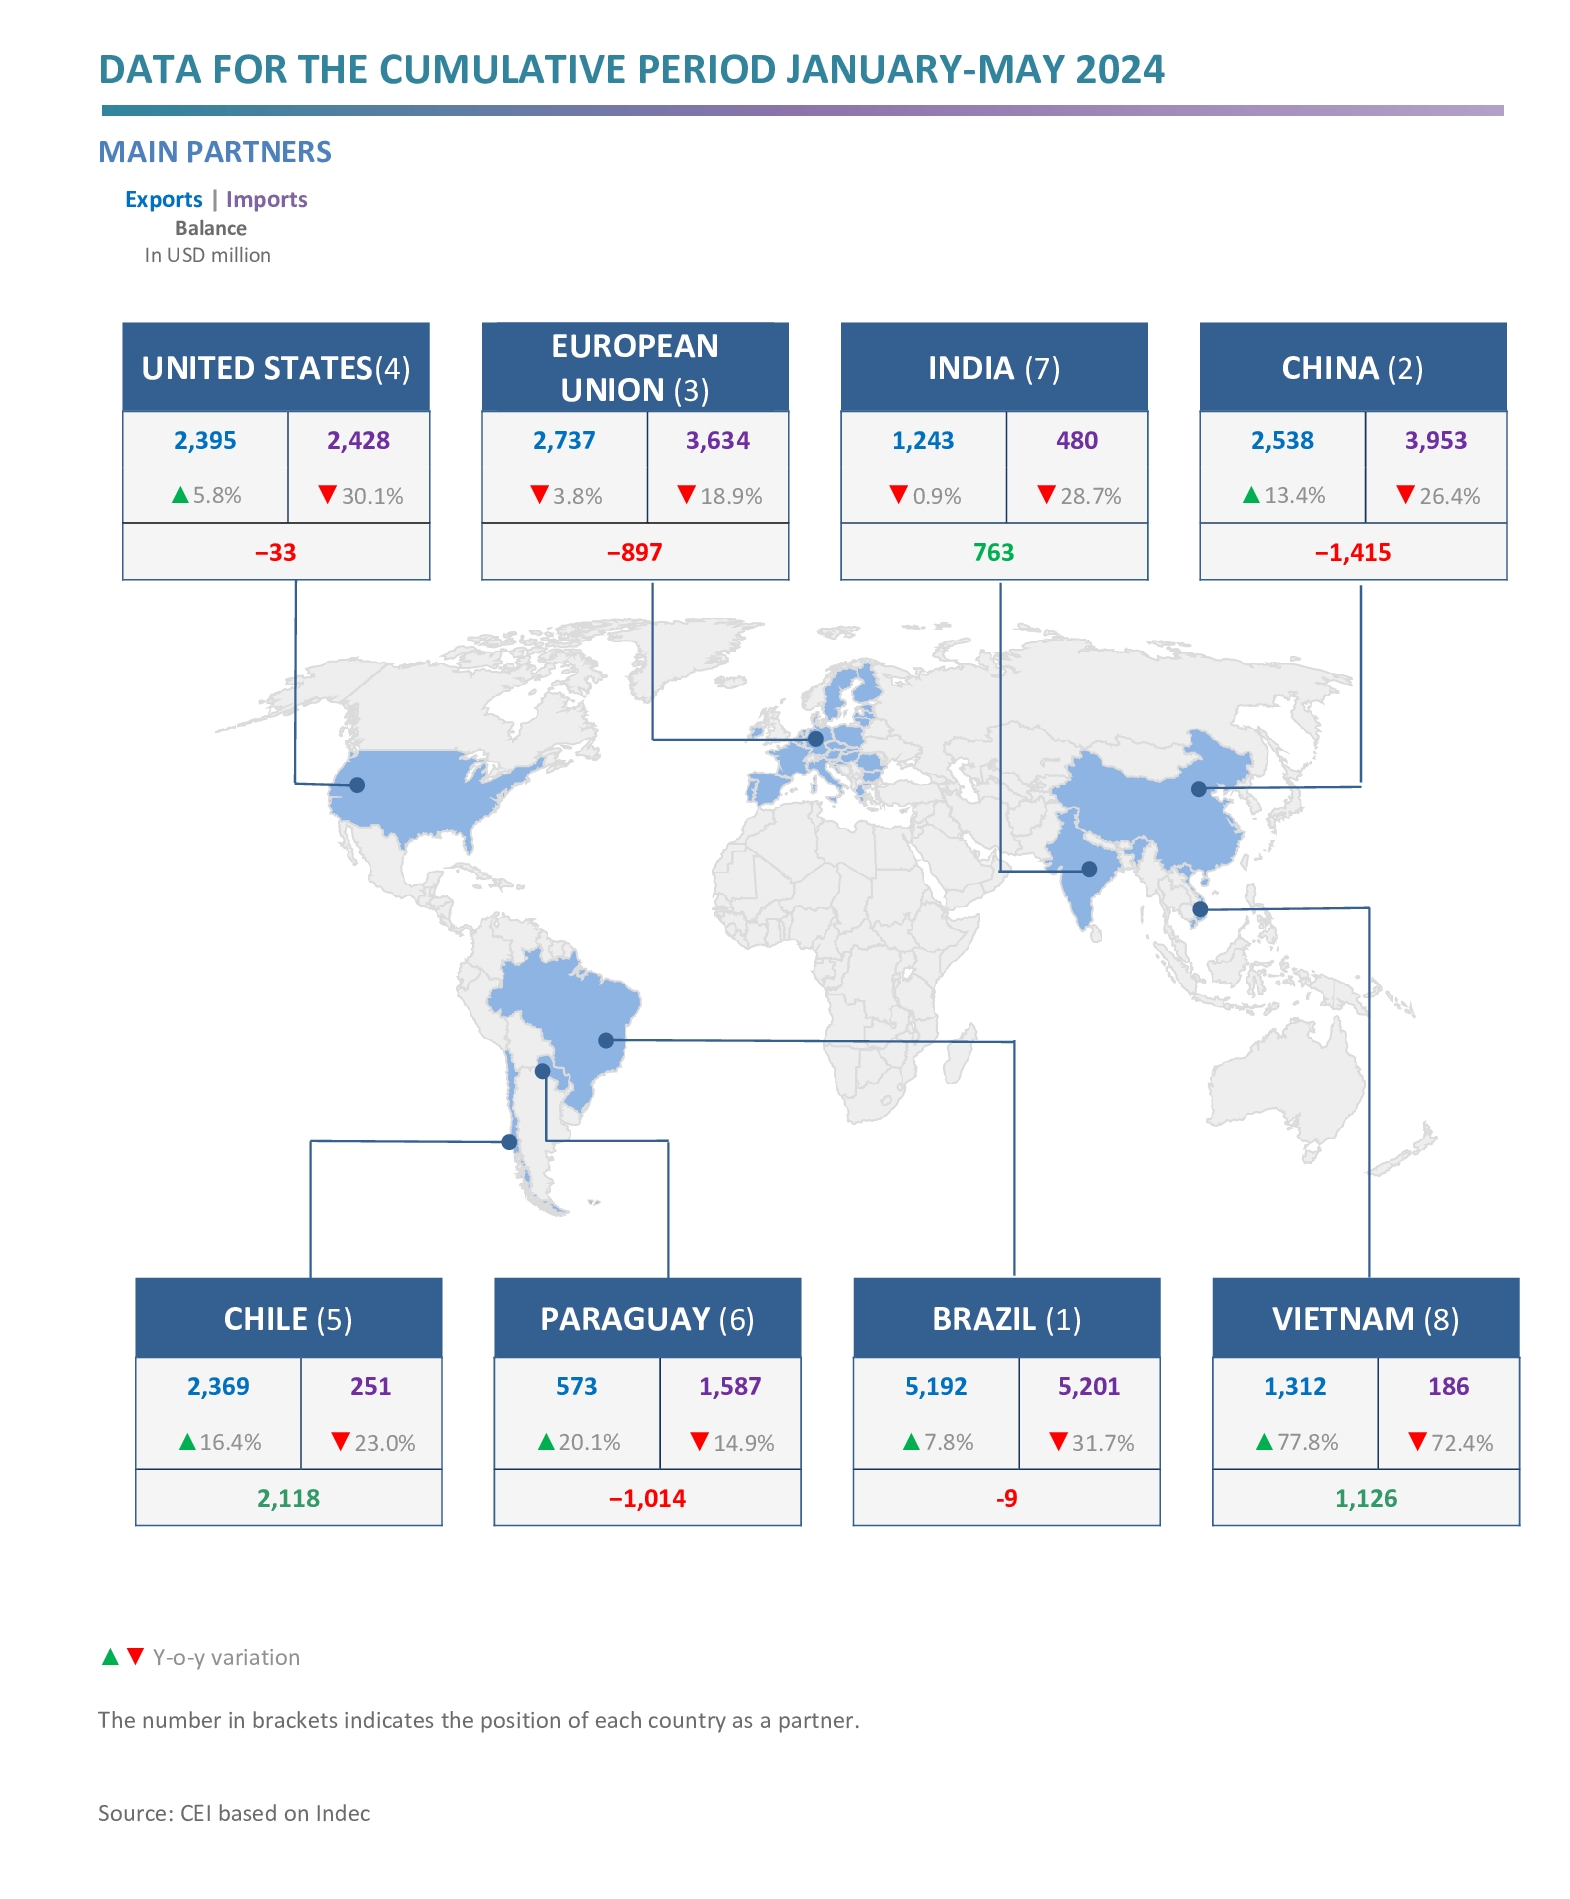
- The main export destinations were Brazil, with a 17.1% share; the EU, with 8.3%; Chile, with 7.9%; and the United States, 7.8%. The most important import origins were Brazil (22.9%), China (17.9%), the EU (16.1%) and the United States (10.6%).
- The largest surpluses were obtained in the trade with Chile (USD 1.7 billion), Vietnam (USD 879 million), Peru (USD 815 million), India (USD 574 million), Indonesia (USD 525 million) and Saudi Arabia (USD 472 million); while the main deficits were recorded with China (-USD 1.7 billion), Paraguay (-USD 784 million) and Germany (-USD 597 million).

Related documents:
Gallery: