Friday, 19 September 2025
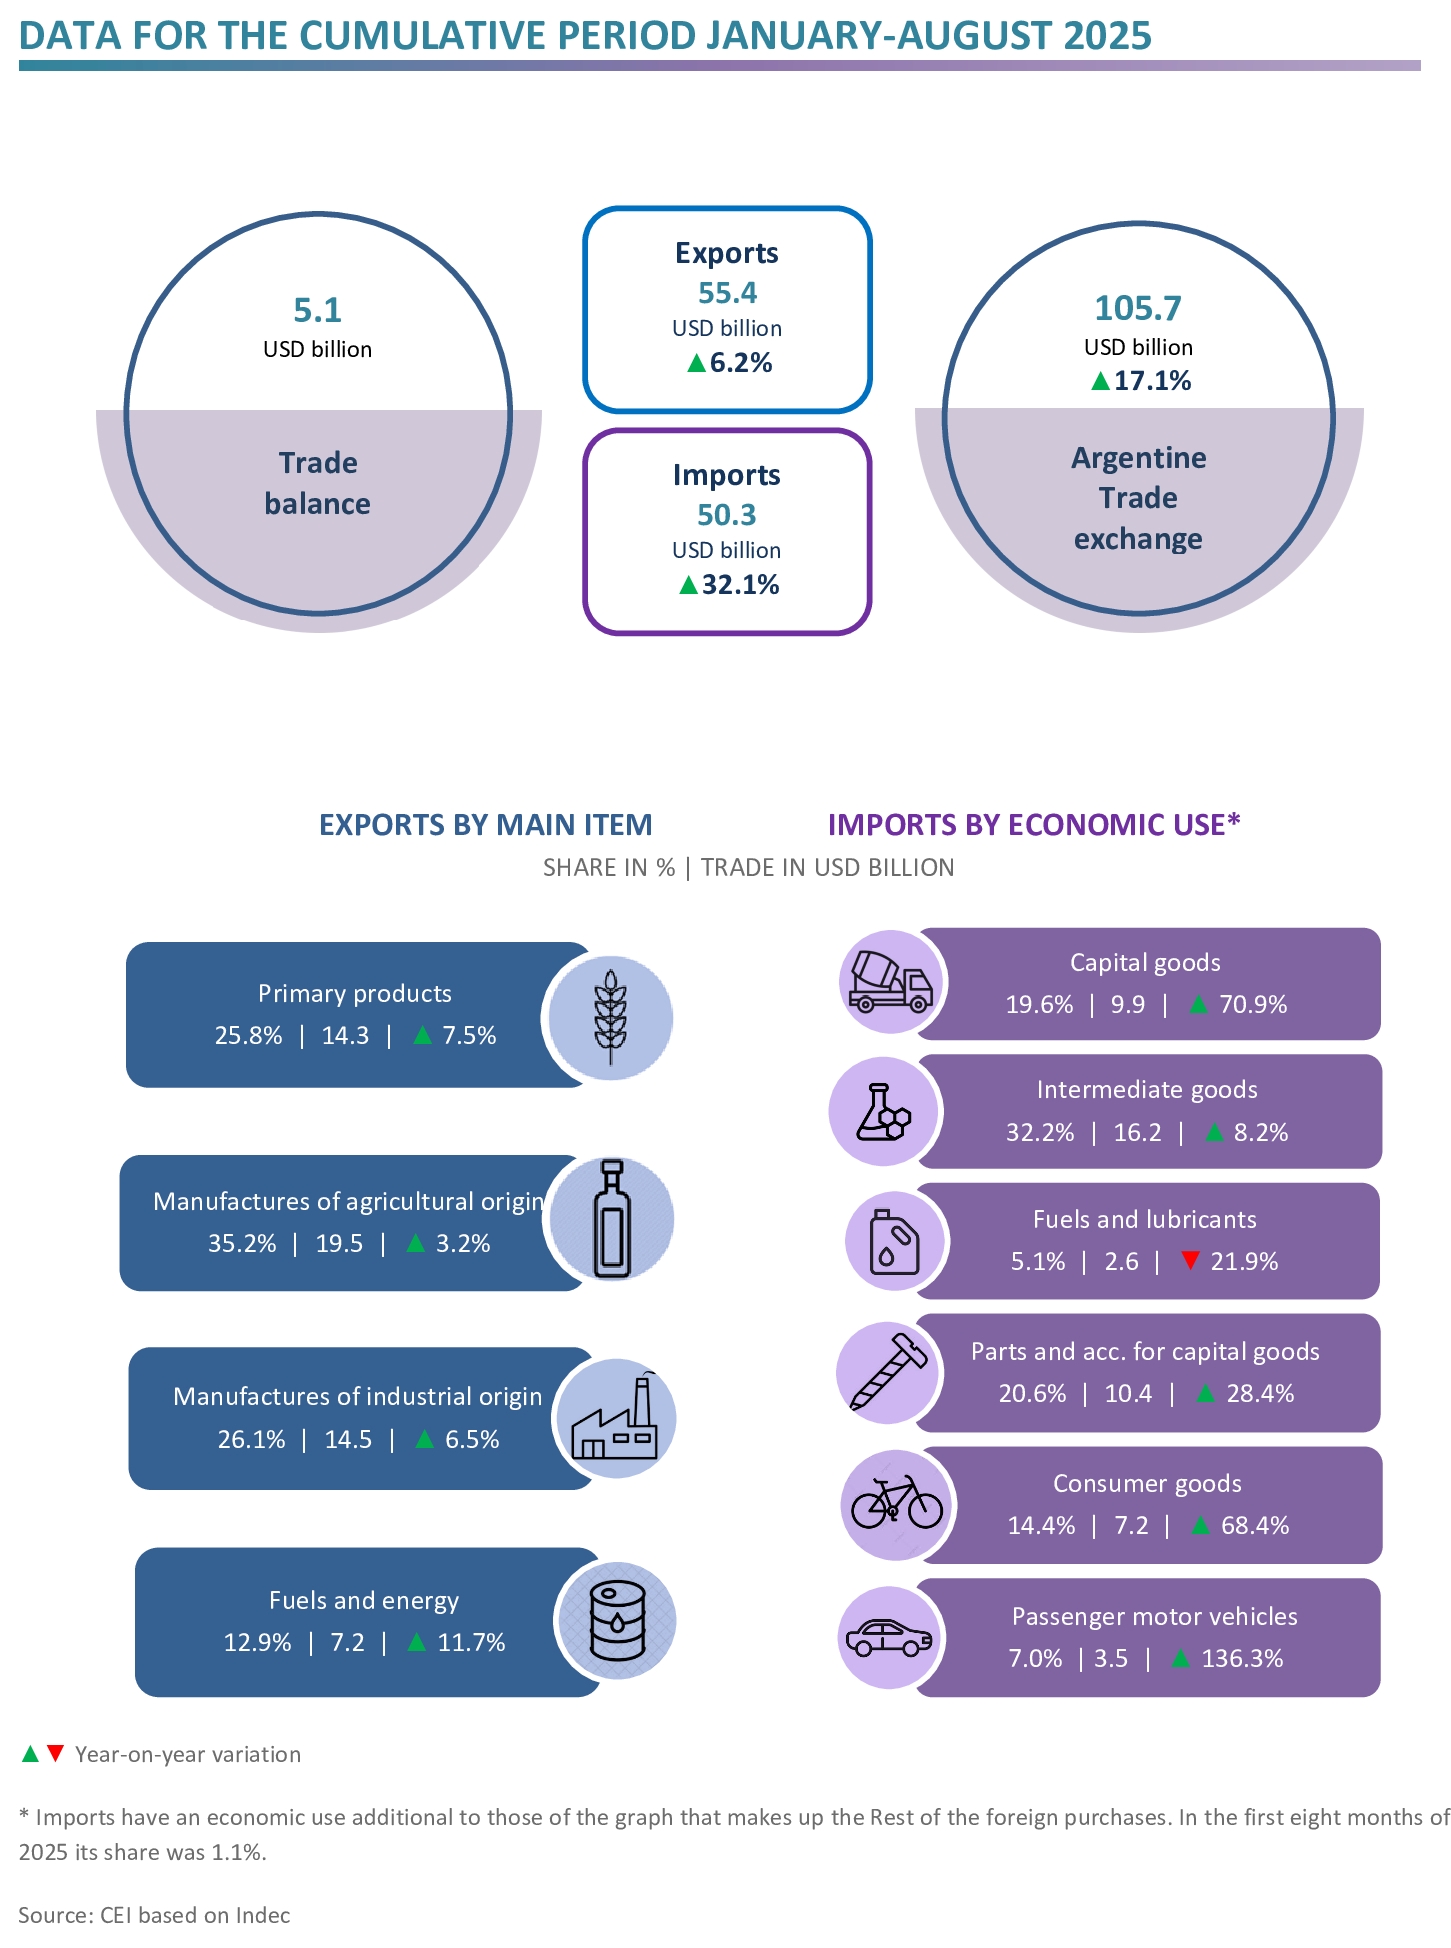
In the first eight months of the year, Argentine exports reached USD 55.4 billion (6.2% growth compared to the same period in 2024), while imports totalled USD 50.3 billion (a 32.1% year-on-year increase). This resulted in a trade surplus of USD 5.1 billion.
HIGHLIGHTS
- In the first eight months of 2025, exports totalled USD 55.4 billion, representing a 6.2% year-on-year increase, as a result of a rise in the exported quantities (6.5%) that more than offset the decrease in prices (‑0.3%).
- Imports amounted to USD 50.3 billion and grew 32.1% year-on-year, owing to the 41.7% increase in the imported quantities, while prices fell 6.8%. This is mainly due to higher quantities of passenger motor vehicles, capital goods, consumer goods and parts and accessories for capital goods.
- Consequently, the trade balance reached a surplus of USD 5.1 billion, while in the same period of 2024 a positive balance of USD 14.1 billion had been recorded.

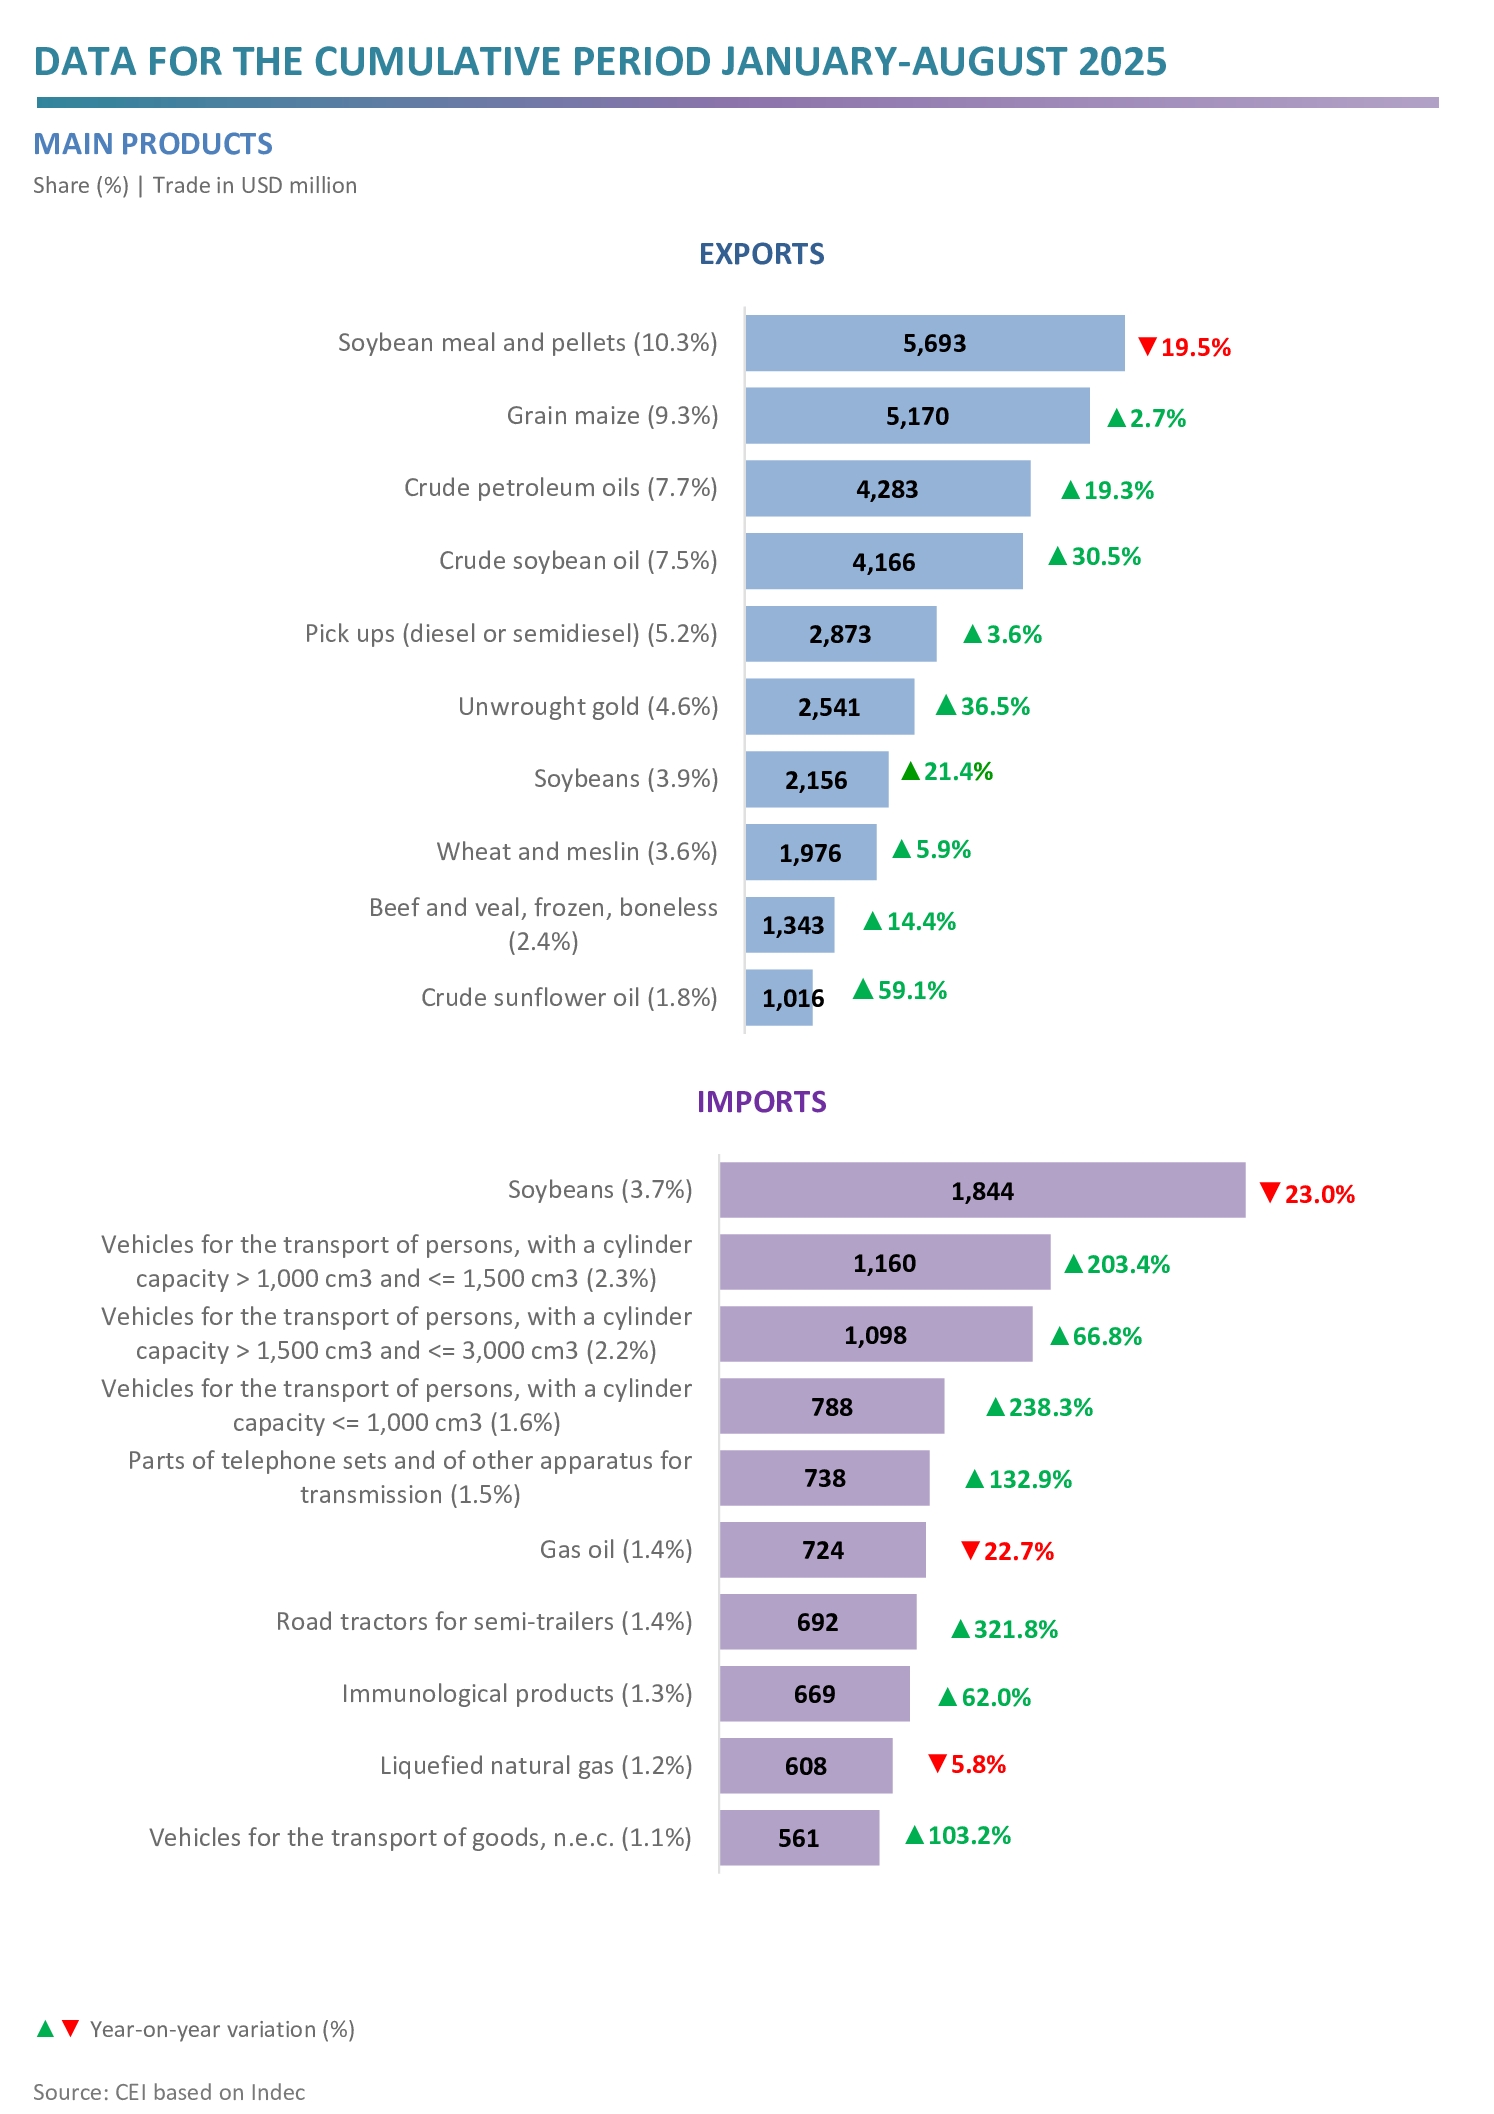
- With regard to exports, the increases in sales of crude soybean oil (USD 972 million), crude petroleum oils (USD 693 million), unwrought gold (USD 680 million) and soybeans (USD 380 million) stand out. In turn, the largest drops occurred in soybean flour and pellets (-USD 1,383 million), frozen shrimp and prawns (-USD 205 million) and motor vehicles for the transport of persons (-USD 187 million).
- In relation to the soybean complex, the prices of flour and pellets (‑22.2%) and beans (‑9.7%) fell, whereas those of crude oil (14.4%) went up. As for the quantities exported, rises were recorded in those of beans (-34.5%), crude oil (14.0%), and flour and pellets (3.5%).
- Regarding imports, the most significant increases occurred in the purchases of vehicles for the transport of persons (USD 2.1 billion), chassis, parts and tyres (USD 1.2 billion), vehicles for the transport of goods (USD 658 million), and telephone parts (USD 421 million); on the other hand, those of soybeans (‑USD 551 million), natural gas in gaseous state (‑USD 491 million), and gas oil (‑USD 213 million) fell.

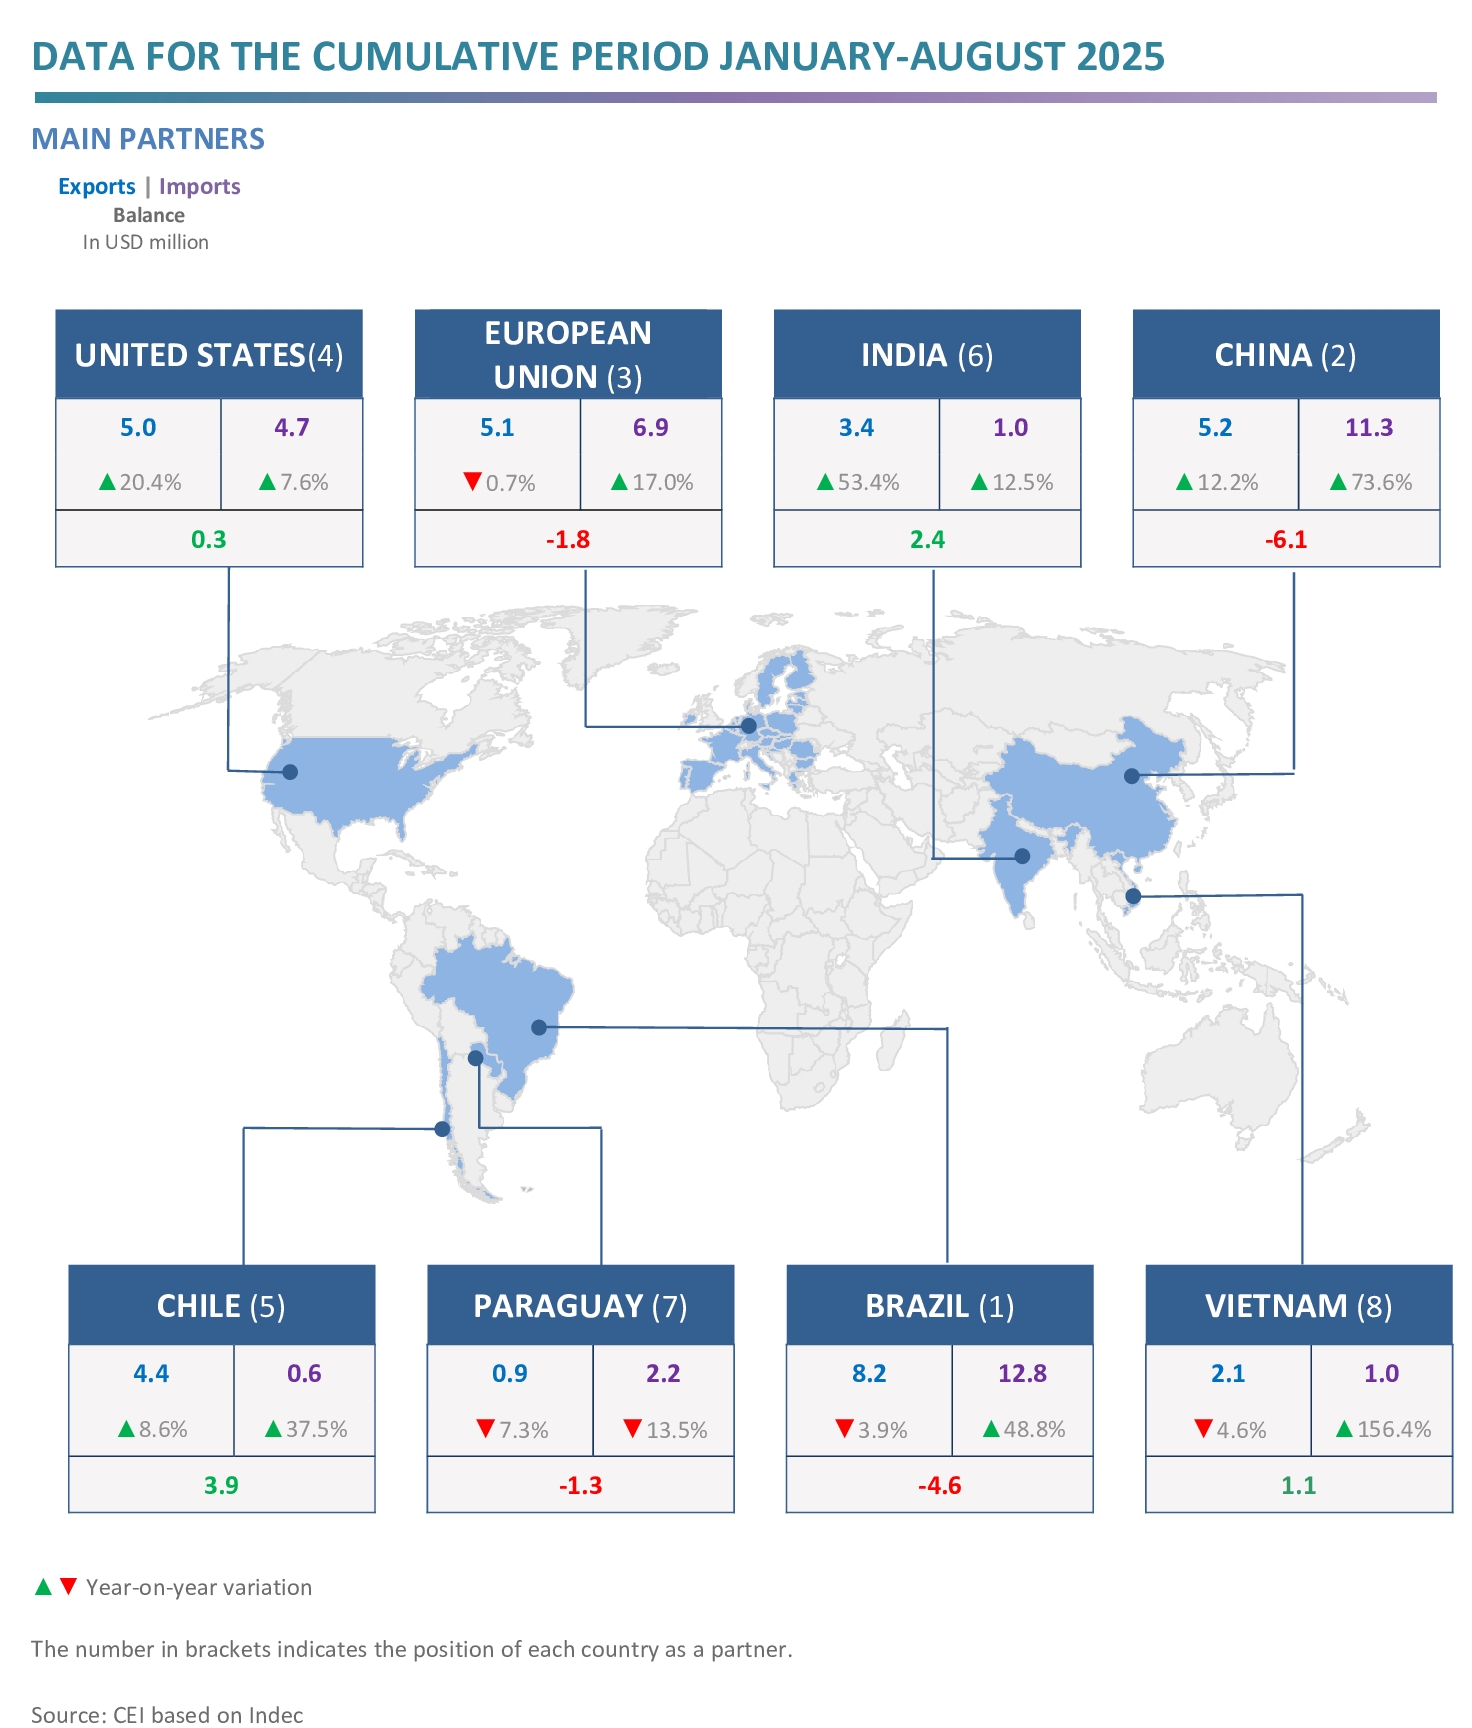
- The main export destinations were Brazil, with a 14.8% share; China, with 9.3%; the EU, with 9.3%; and the United States, with 9.0%. In turn, the most prominent origins of imports were: Brazil, with 25.4% of the total; China, with 22.4%; the EU, with 13.6%; and the United States, with 9.4%.
- The largest surpluses were obtained in trade with Chile (USD 3.9 billion), India (USD 2.4 billion), Peru (USD 1.5 billion), Vietnam (USD 1.1 billion) and Switzerland (USD 1.1 billion); while the main deficits were registered with China (‑USD 6.1 billion), Brazil (‑USD 4.6 billion) and Germany (‑USD 1.4 billion).

The full report in Spanish is available here (with highlights in English).
Documentos relacionados:
Galería: