Friday, 21 March 2025
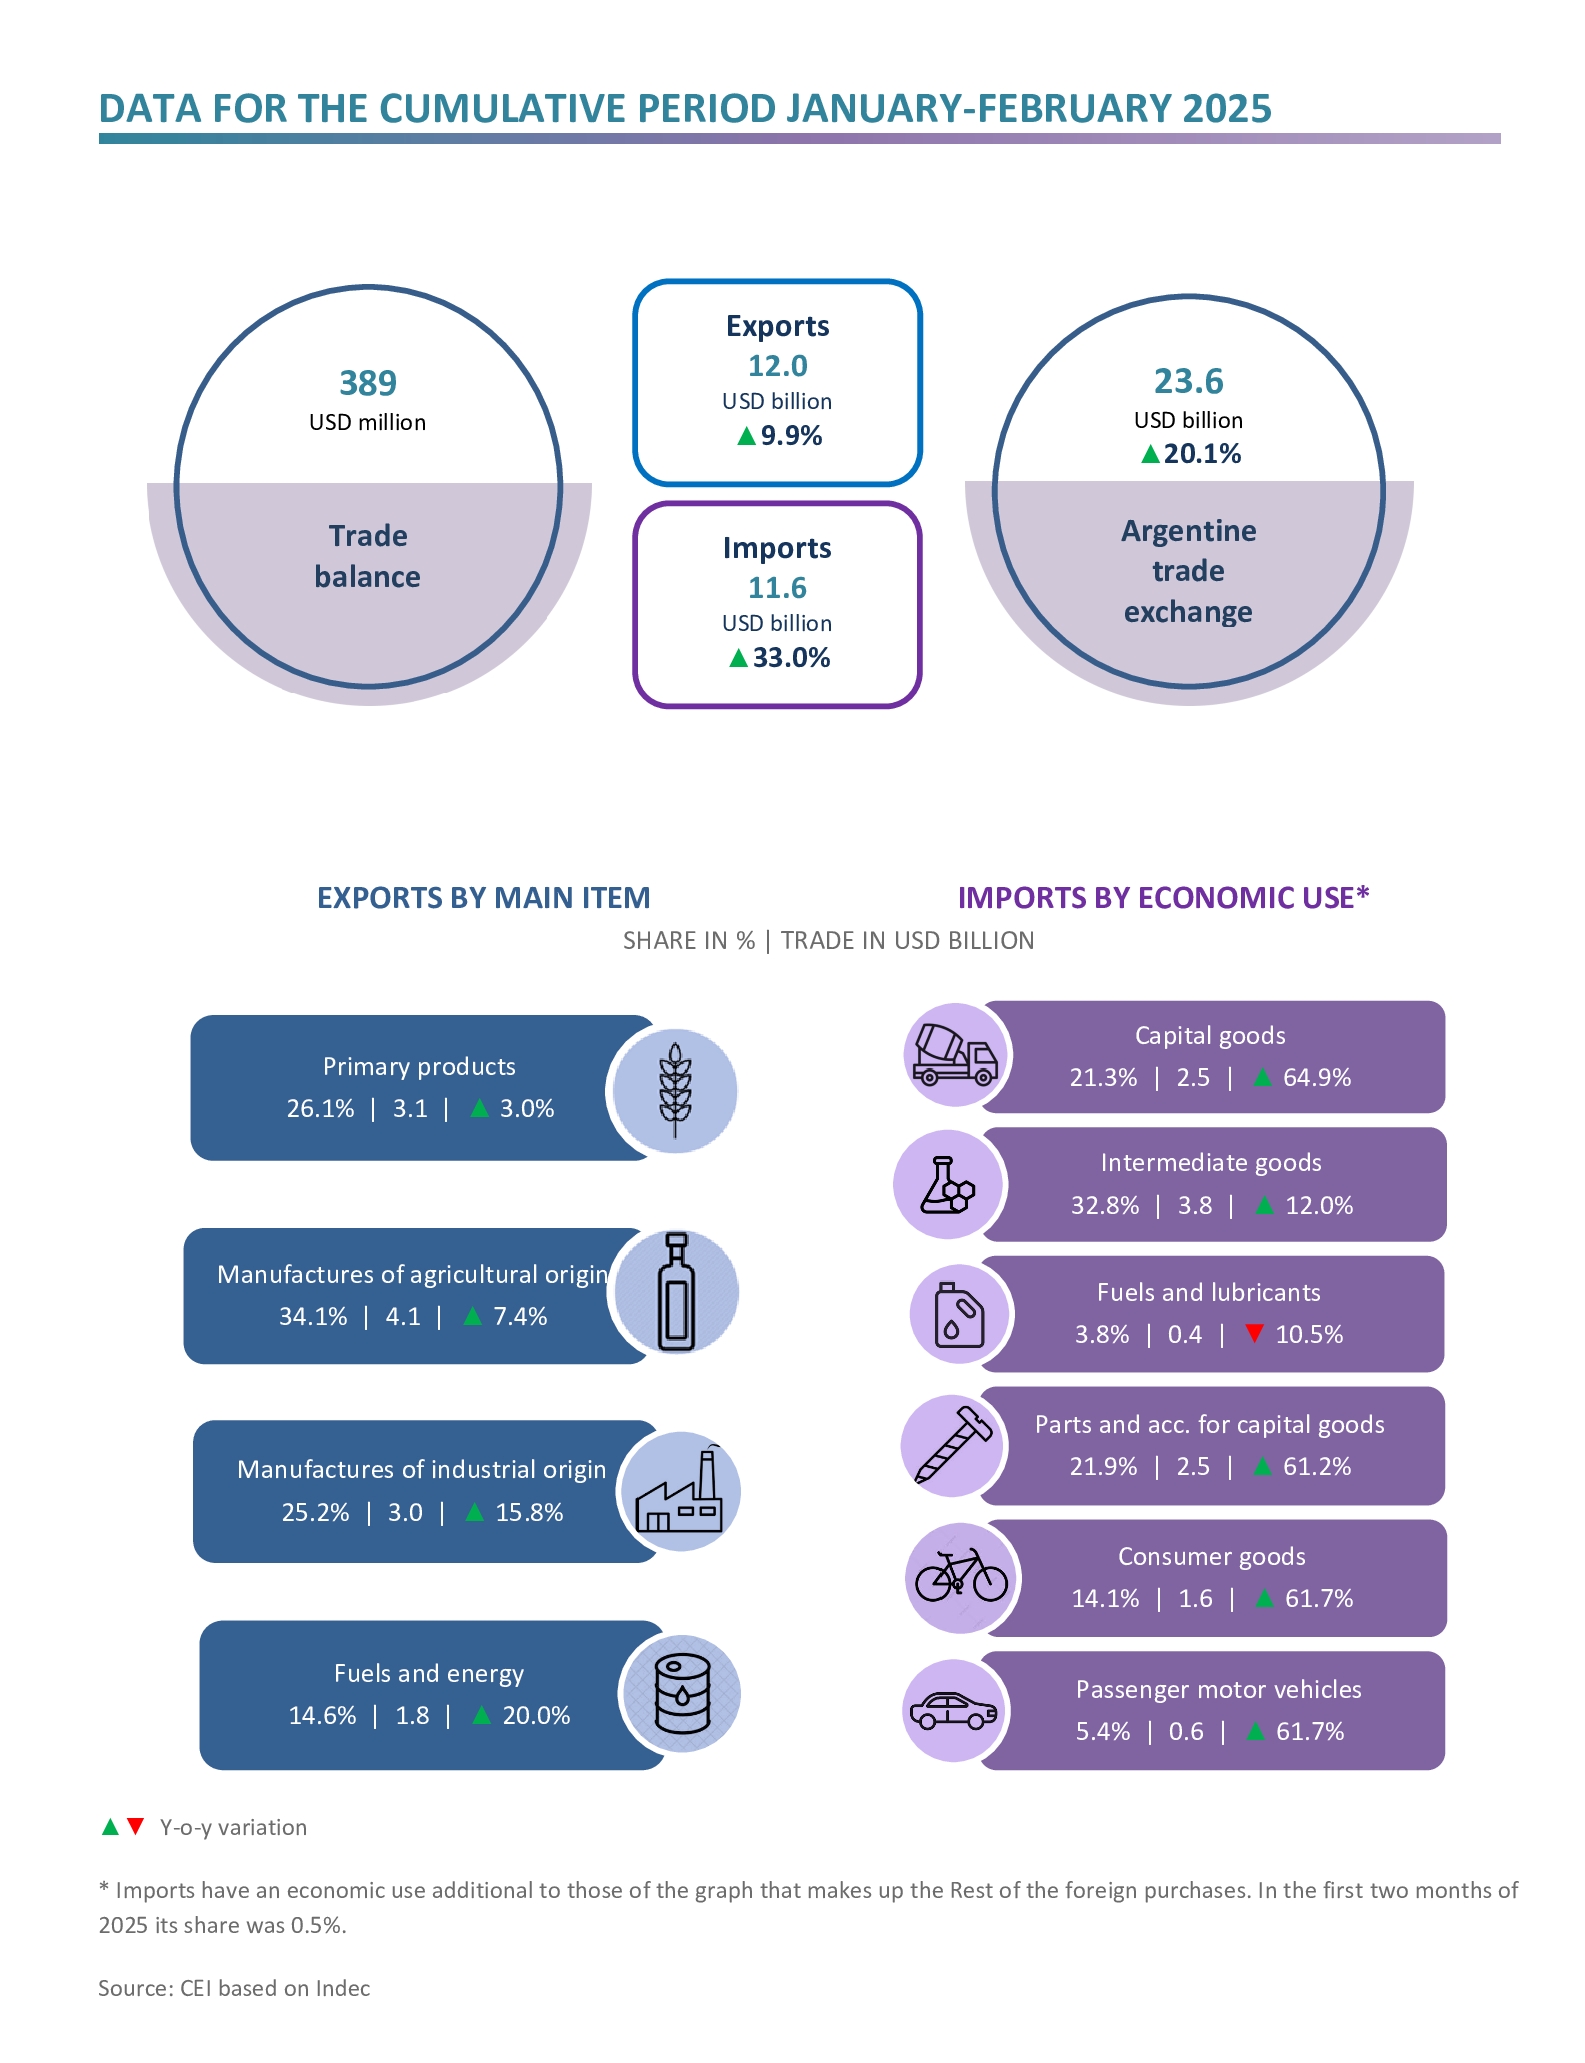
In the first two months of 2025, exports reached USD 12.0 billion (they grew 9.9% compared to the same period in 2024) while imports totalled USD 11.6 billion (a 33.0% y-o-y increase). The trade balance resulted in a USD 389 million surplus.
HIGHLIGHTS
- In January-February 2025, exports reached USD 12.0 billion, which represents a 9.9% year-on-year increase, explained by a 12.1% rise in the quantities exported that exceeded the 2.0% drop in prices.
- Imports amounted to USD 11.6 billion and grew 33.0% in year-on-year terms, as a result of the 45.7% increase in imported quantities whereas prices decreased 8.7%. This is mainly due to higher quantities of capital goods, consumer goods, parts and accessories for capital goods, and passenger motor vehicles.
- Consequently, the trade balance reached a surplus of USD 389 million, when in January-February 2024 a positive balance of USD 2.2 billion had been recorded.

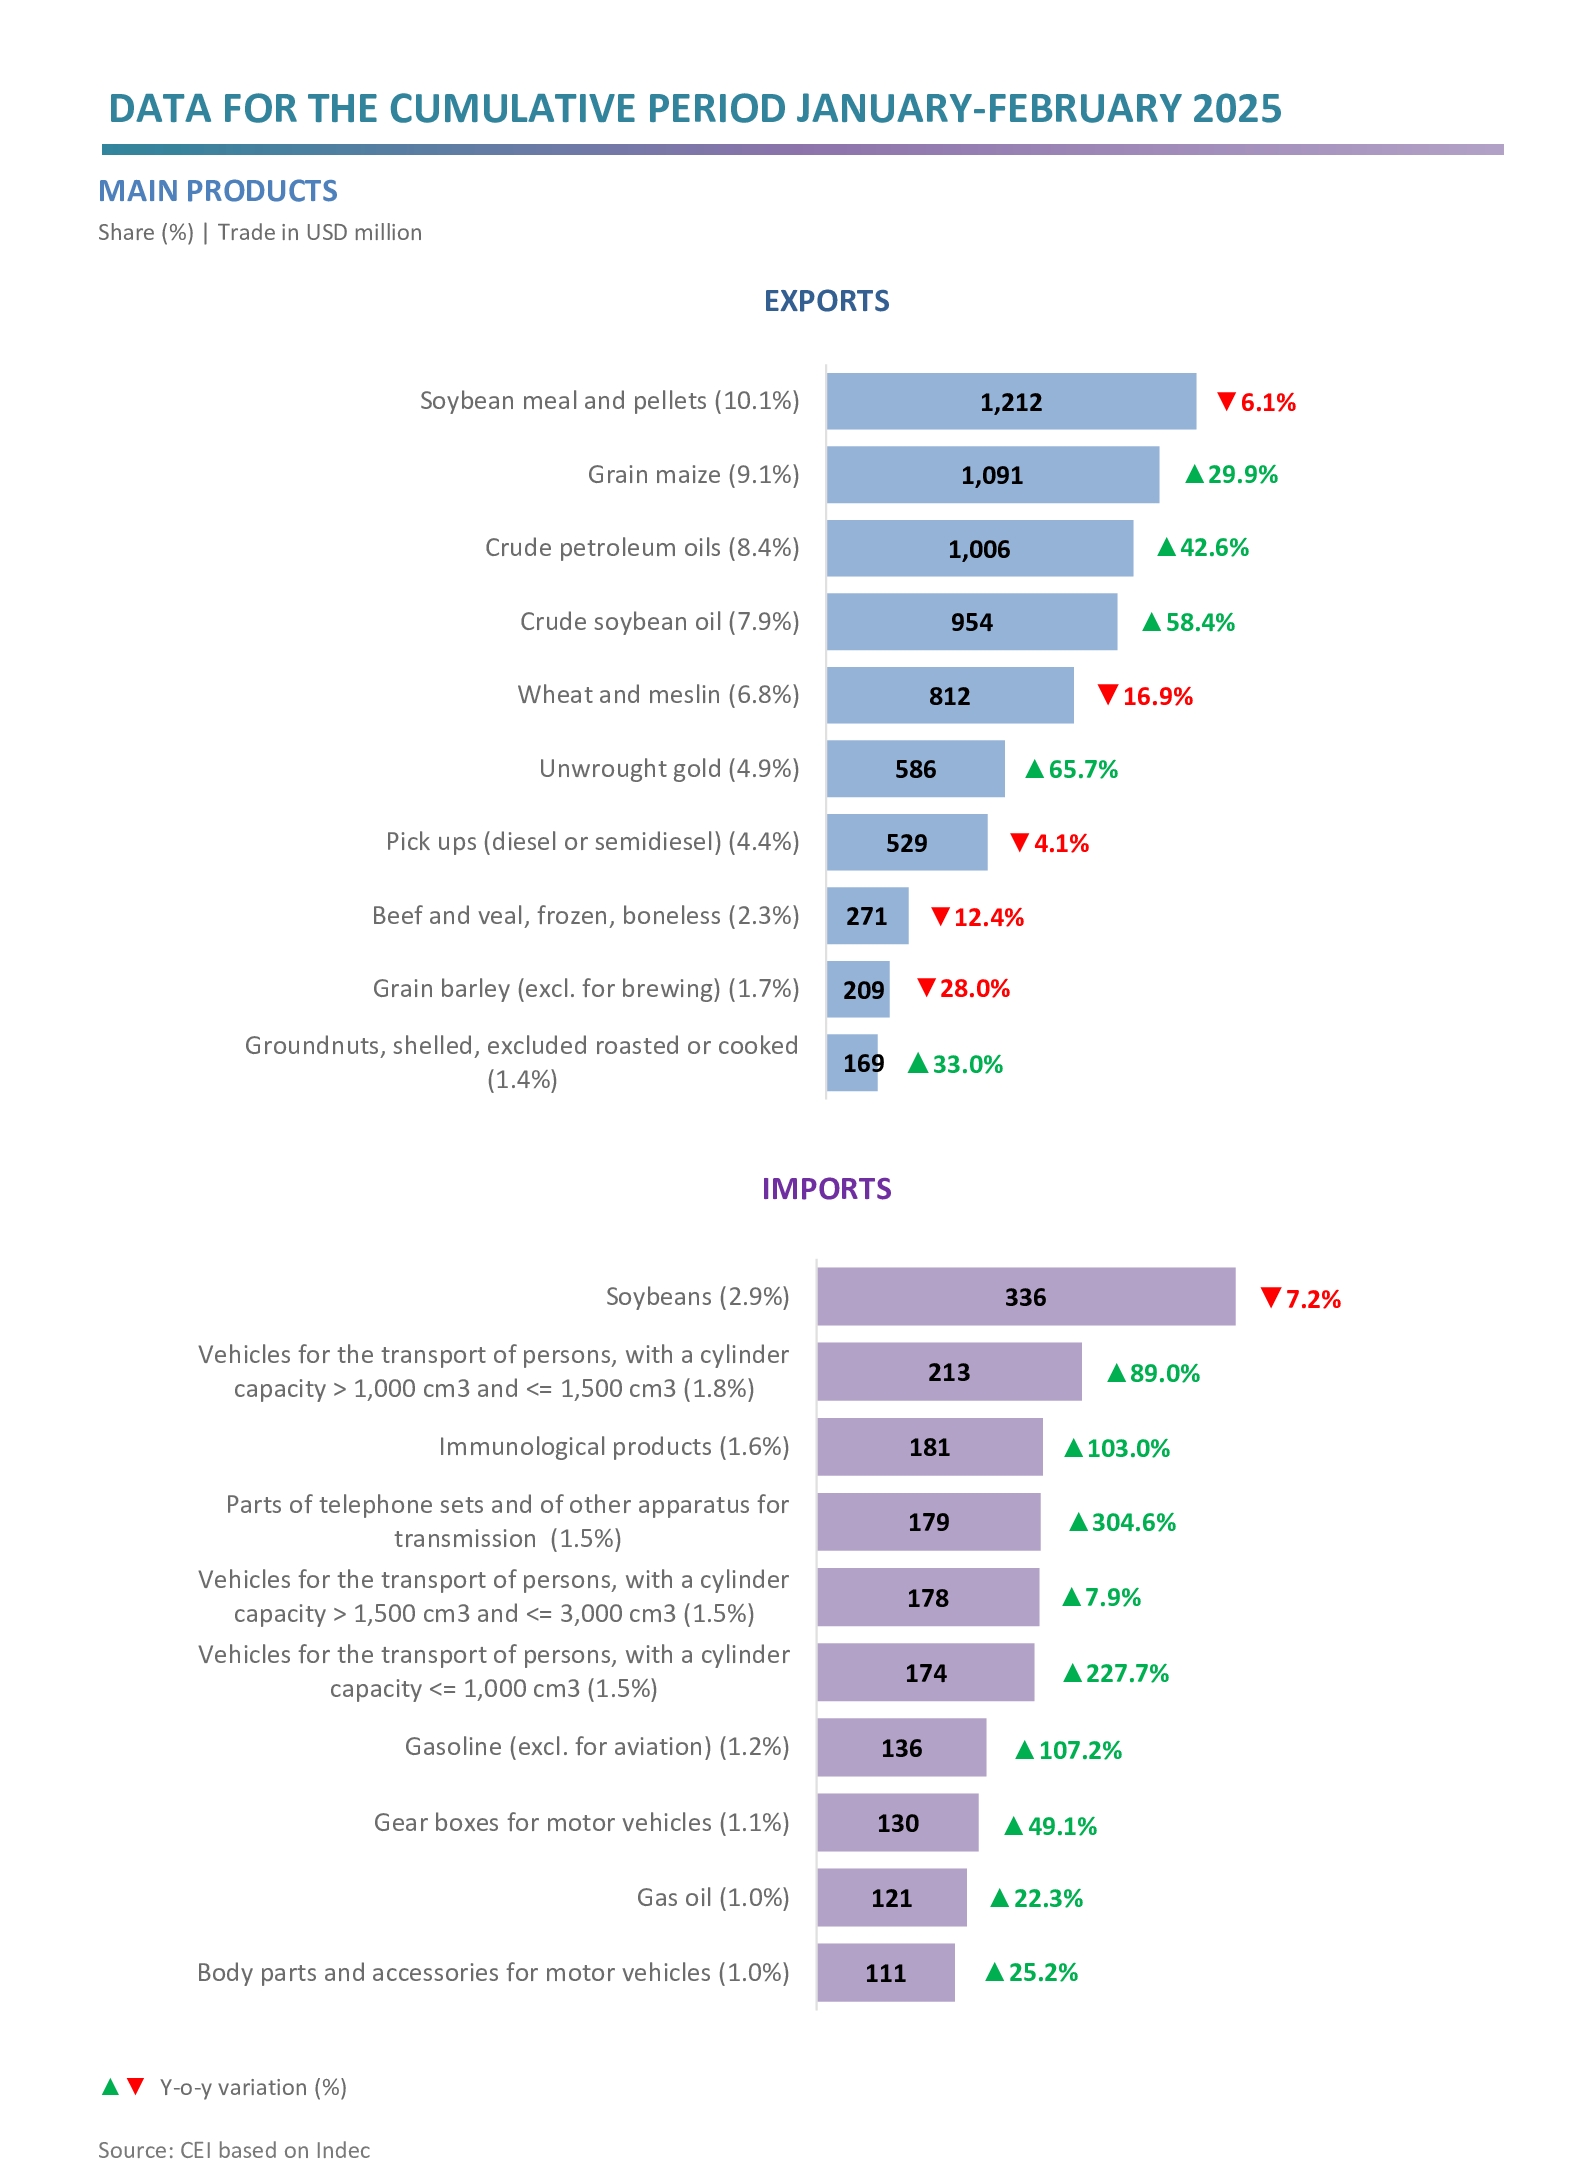
- Among exports, prominent are the increases in crude soybean oil (USD 352 million), crude petroleum oils (USD 301 million) and corn (USD 251 million). Conversely, the largest drops were in wheat (‑USD 165 million), barley grain (‑USD 81 million) and soybean flour and pellets (‑USD 79 million).
- In relation to the soybean complex, the prices of flour and pellets (‑26.9%) and beans (‑18.8%) fell, while those of crude oil (18.9%) climbed. As for the quantities exported, those of crude oil (33.3%) and flour and pellets (28.5%) increased, and those of beans (‑72.5%) decreased. In the first two months of the year, there were no biodiesel exports recorded.
- Regarding imports, the most significant rises occurred in the purchases of chassis, parts and tires (USD 380 million), vehicles for the transport of people (USD 241 million) and telephone parts (USD 135 million); on the other hand those of natural gas in gaseous state (‑USD 97 million), electric energy (‑USD 62 million) and glyphosate (‑USD 50 million) fell.

- The main export destinations were Brazil, with a 15.1% share; Chile, with 9.7%; the United States, with 8.2%; and the EU, with 7.8%. In turn, the most prominent sources of imports were: China, with 26.0% of the total imported; Brazil, with 22.9%, the EU, with 14.4%, and the United States, with 8.8%.
- The largest surpluses were obtained in trade with Chile (USD 985 million), India (USD 475 million), Peru (USD 361 million), Saudi Arabia (USD 296 million) and Switzerland (USD 269 million); while the main deficits were registered with China (‑USD 2.4 billion), Brazil (‑USD 854 million) and Germany (‑USD 407 million).

Read the full report in Spanish here (with highlights in English).
Documentos relacionados:
Galería: