
Thursday, 19 June 2025
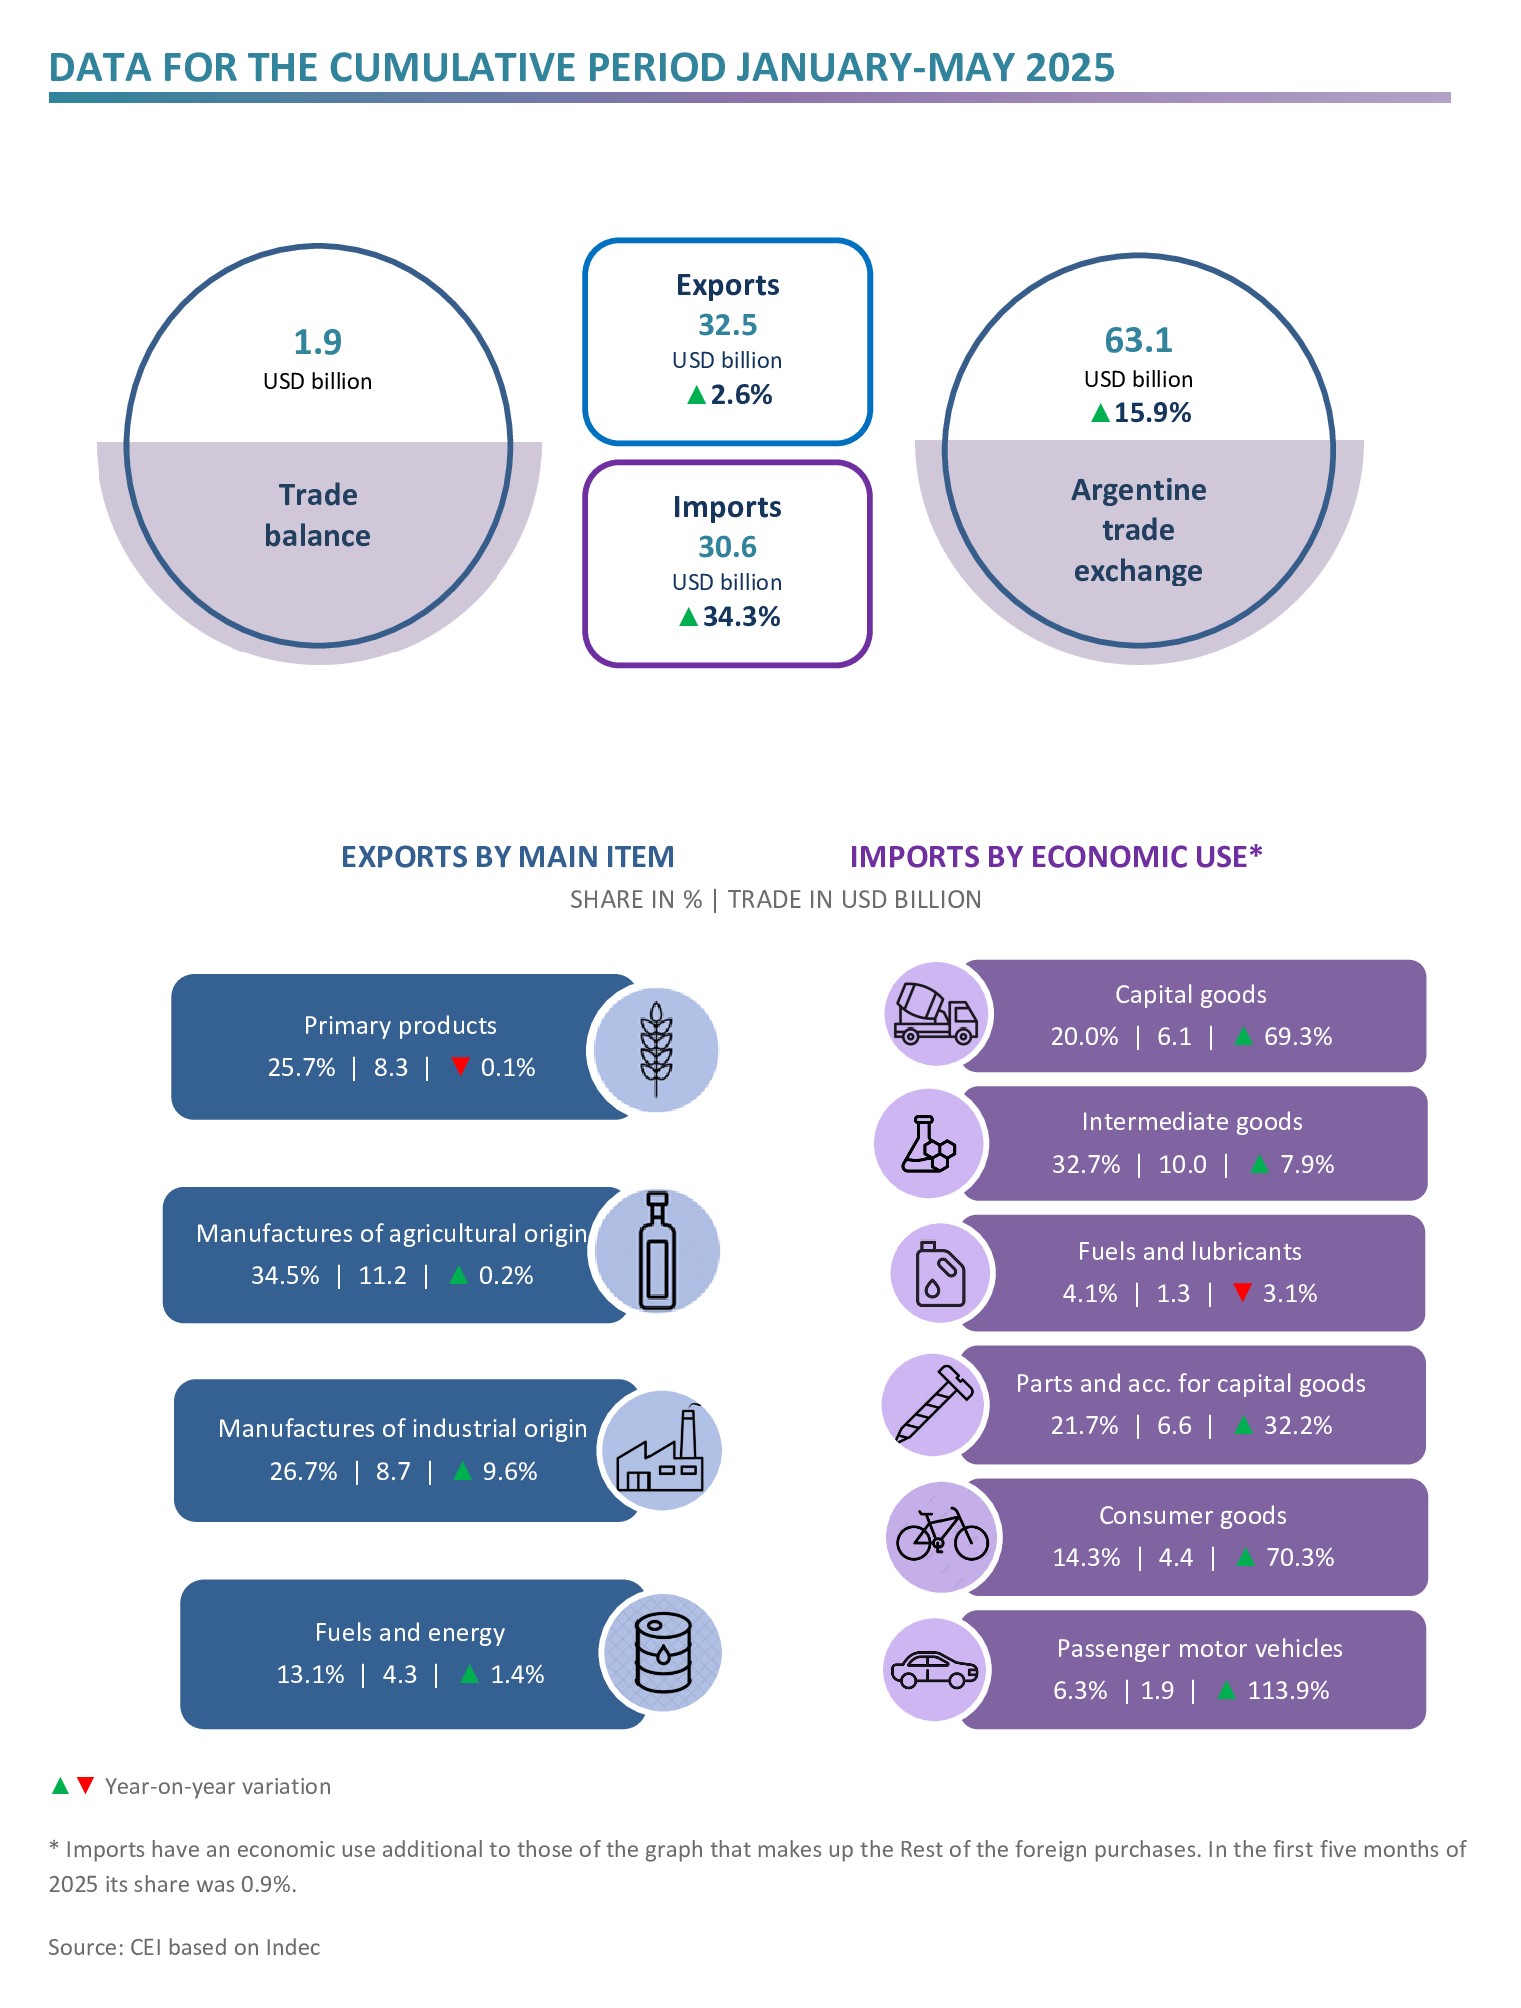
In the first five months of 2025, Argentine exports reached USD 32.5 billion (up 2.6% with respect to the same period of 2024), while imports amounted to USD 30.6 billion (they increased 34.3% year on year). The trade balance reached a surplus of USD 1.9 billion.
HIGHLIGHTS
- In the first five months of 2025, exports totalled USD 32.5 billion, which represents a year-on-year increase of 2.6%, as a result of an increase in the quantities exported (3.4%) that more than offset the decrease in prices (‑0.8%).
- Imports amounted to USD 30.6 billion and grew 34.3% year-on-year, owing to the 43.6% rise in imported quantities, while prices dropped 6.4%. This is mainly due to higher quantities of passenger motor vehicles, capital goods, consumer goods and parts and accessories for capital goods.
- Consequently, the trade balance reached a surplus of USD 1.9 billion, whereas in January-May 2024 a positive balance of USD 8.9 billion had been recorded
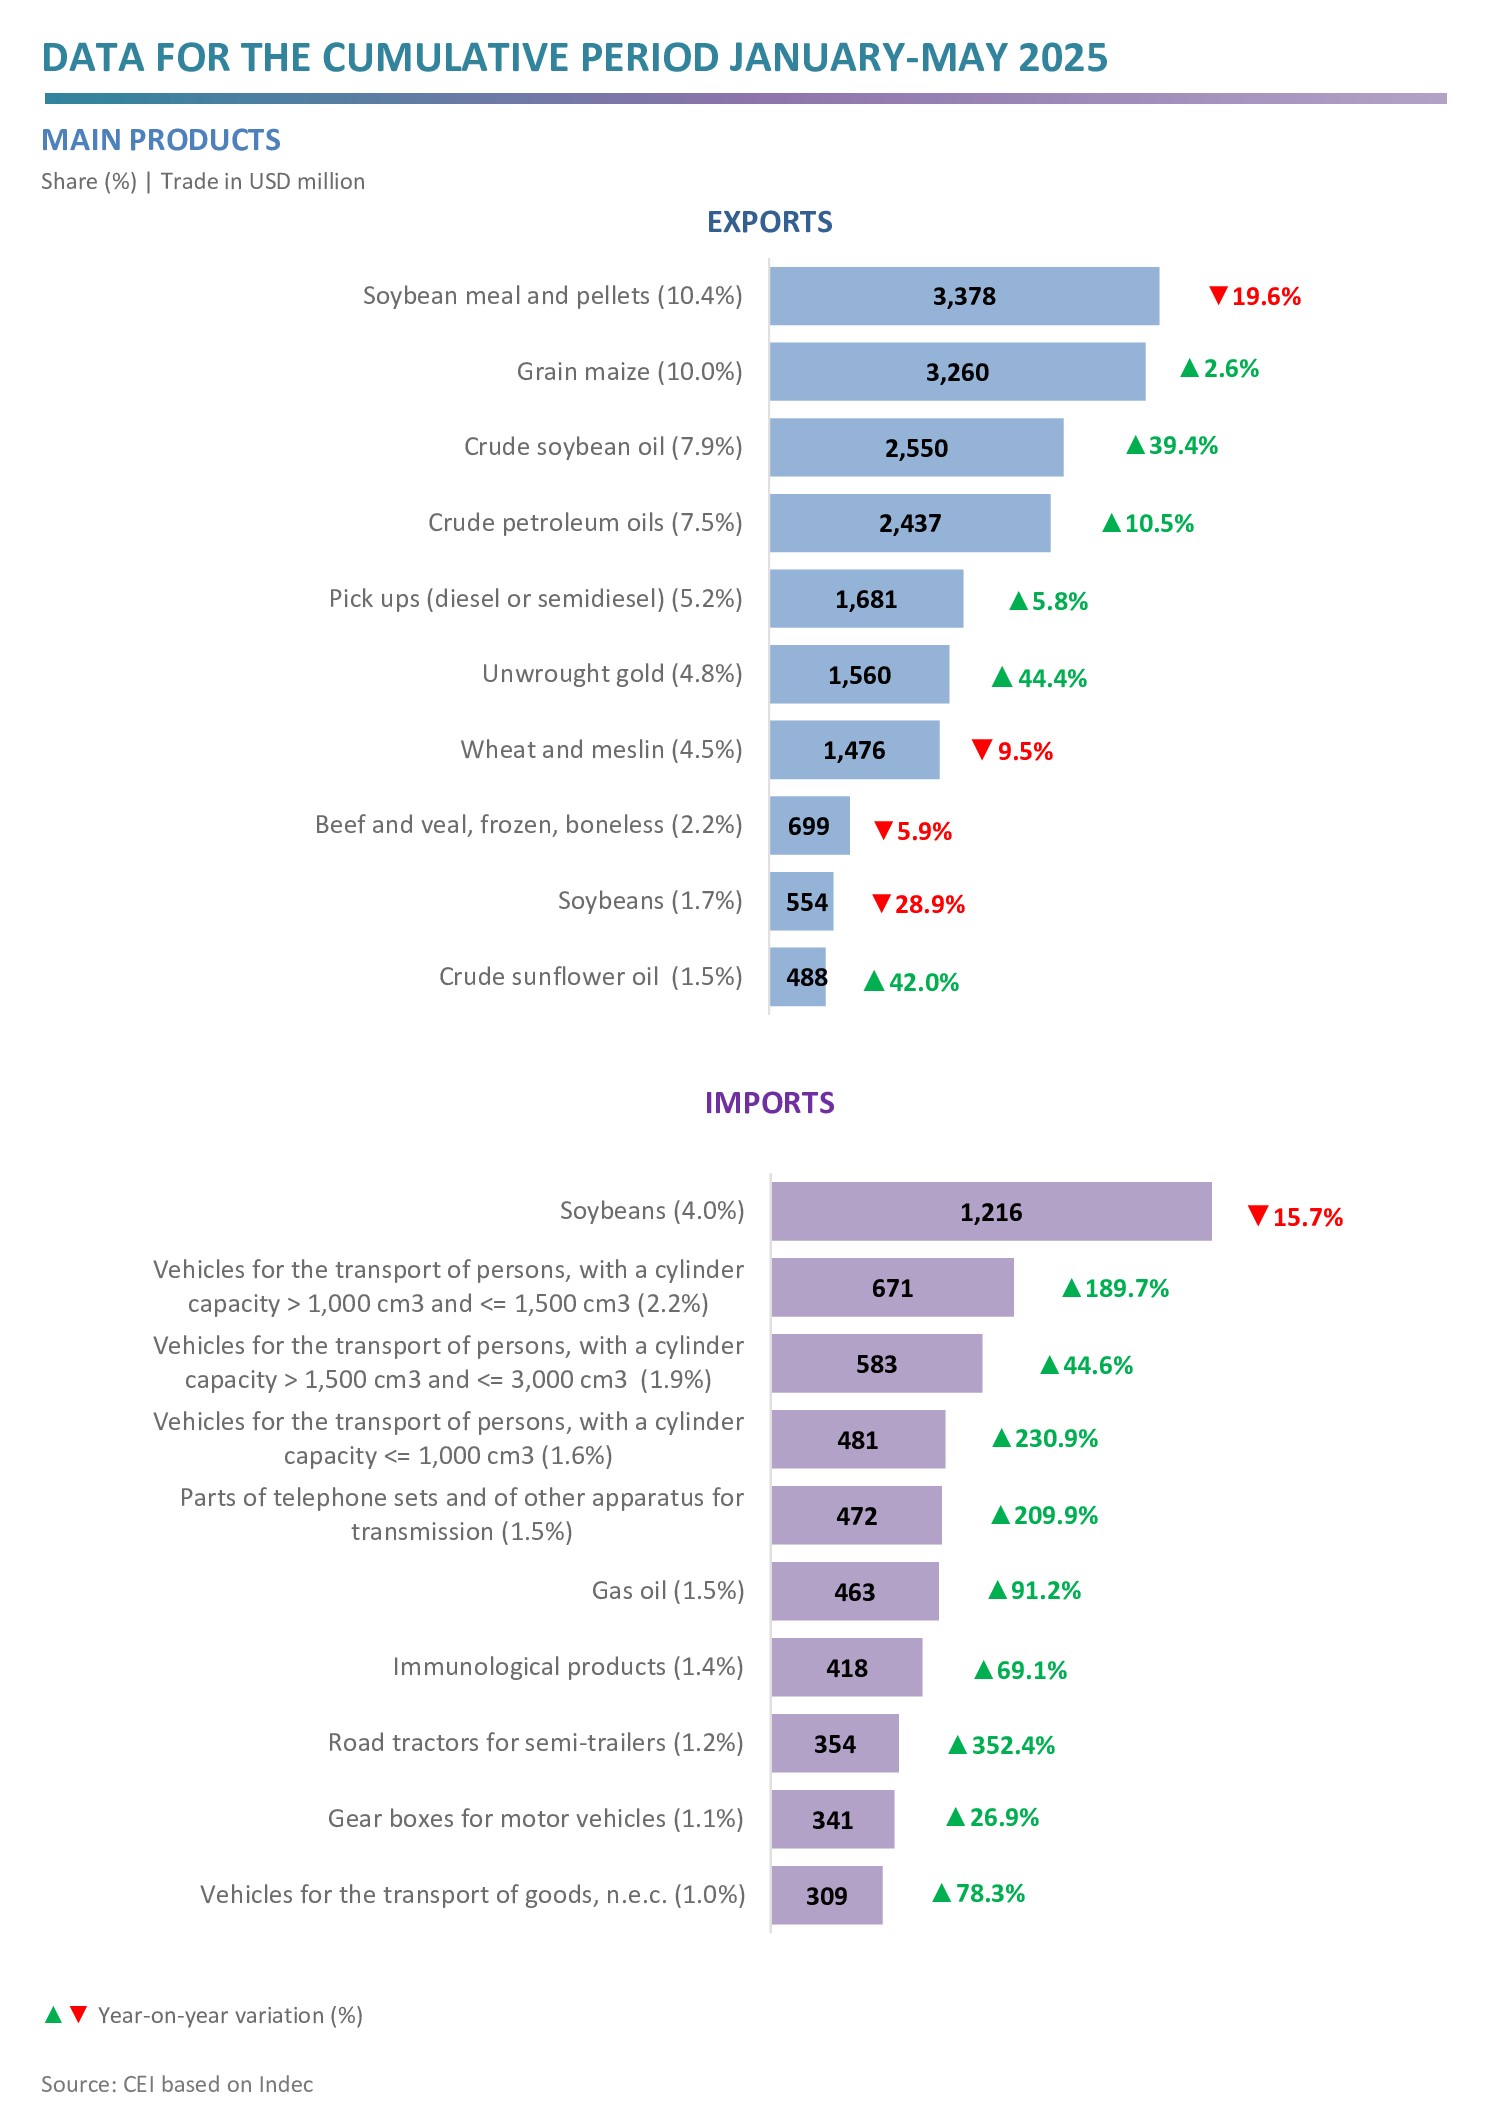
- Prominent are the increases in exports of soybean crude oil (USD 721 million), unwrought gold (USD 480 million), crude petroleum oils (USD 232 million), and sunflower oil (USD 144 million); while the largest falls were observed in soybean flour and pellets (‐USD 823 million), soybean oil, excluded crude (‐USD 232 million), soybeans (-USD 225 million) and wheat (‐USD 155 million).
- In relation to the soybean complex, the prices of flour and pellets (‑21.9%) and beans (‑11.7%) went down, while those of crude oil (17.1%) and biodiesel went up. As for the quantities exported, those of crude oil (19.0%) and flour and pellets (3.0%) increased, and those of beans (‑19.4%) and biodiesel decreased.
- Regarding imports, the most significant increases occurred in the purchases of vehicles for the transport of persons (USD 1,052 million), chassis, parts and tyres (USD 843 million), vehicles for the transport of goods (USD 325 million) and telephone parts (USD 320 million); while those of natural gas in gaseous state (‑USD 265 million), soybeans (‑USD 226 million) and iron agglomerates by pelletisation process (‑USD 141 million) fell.
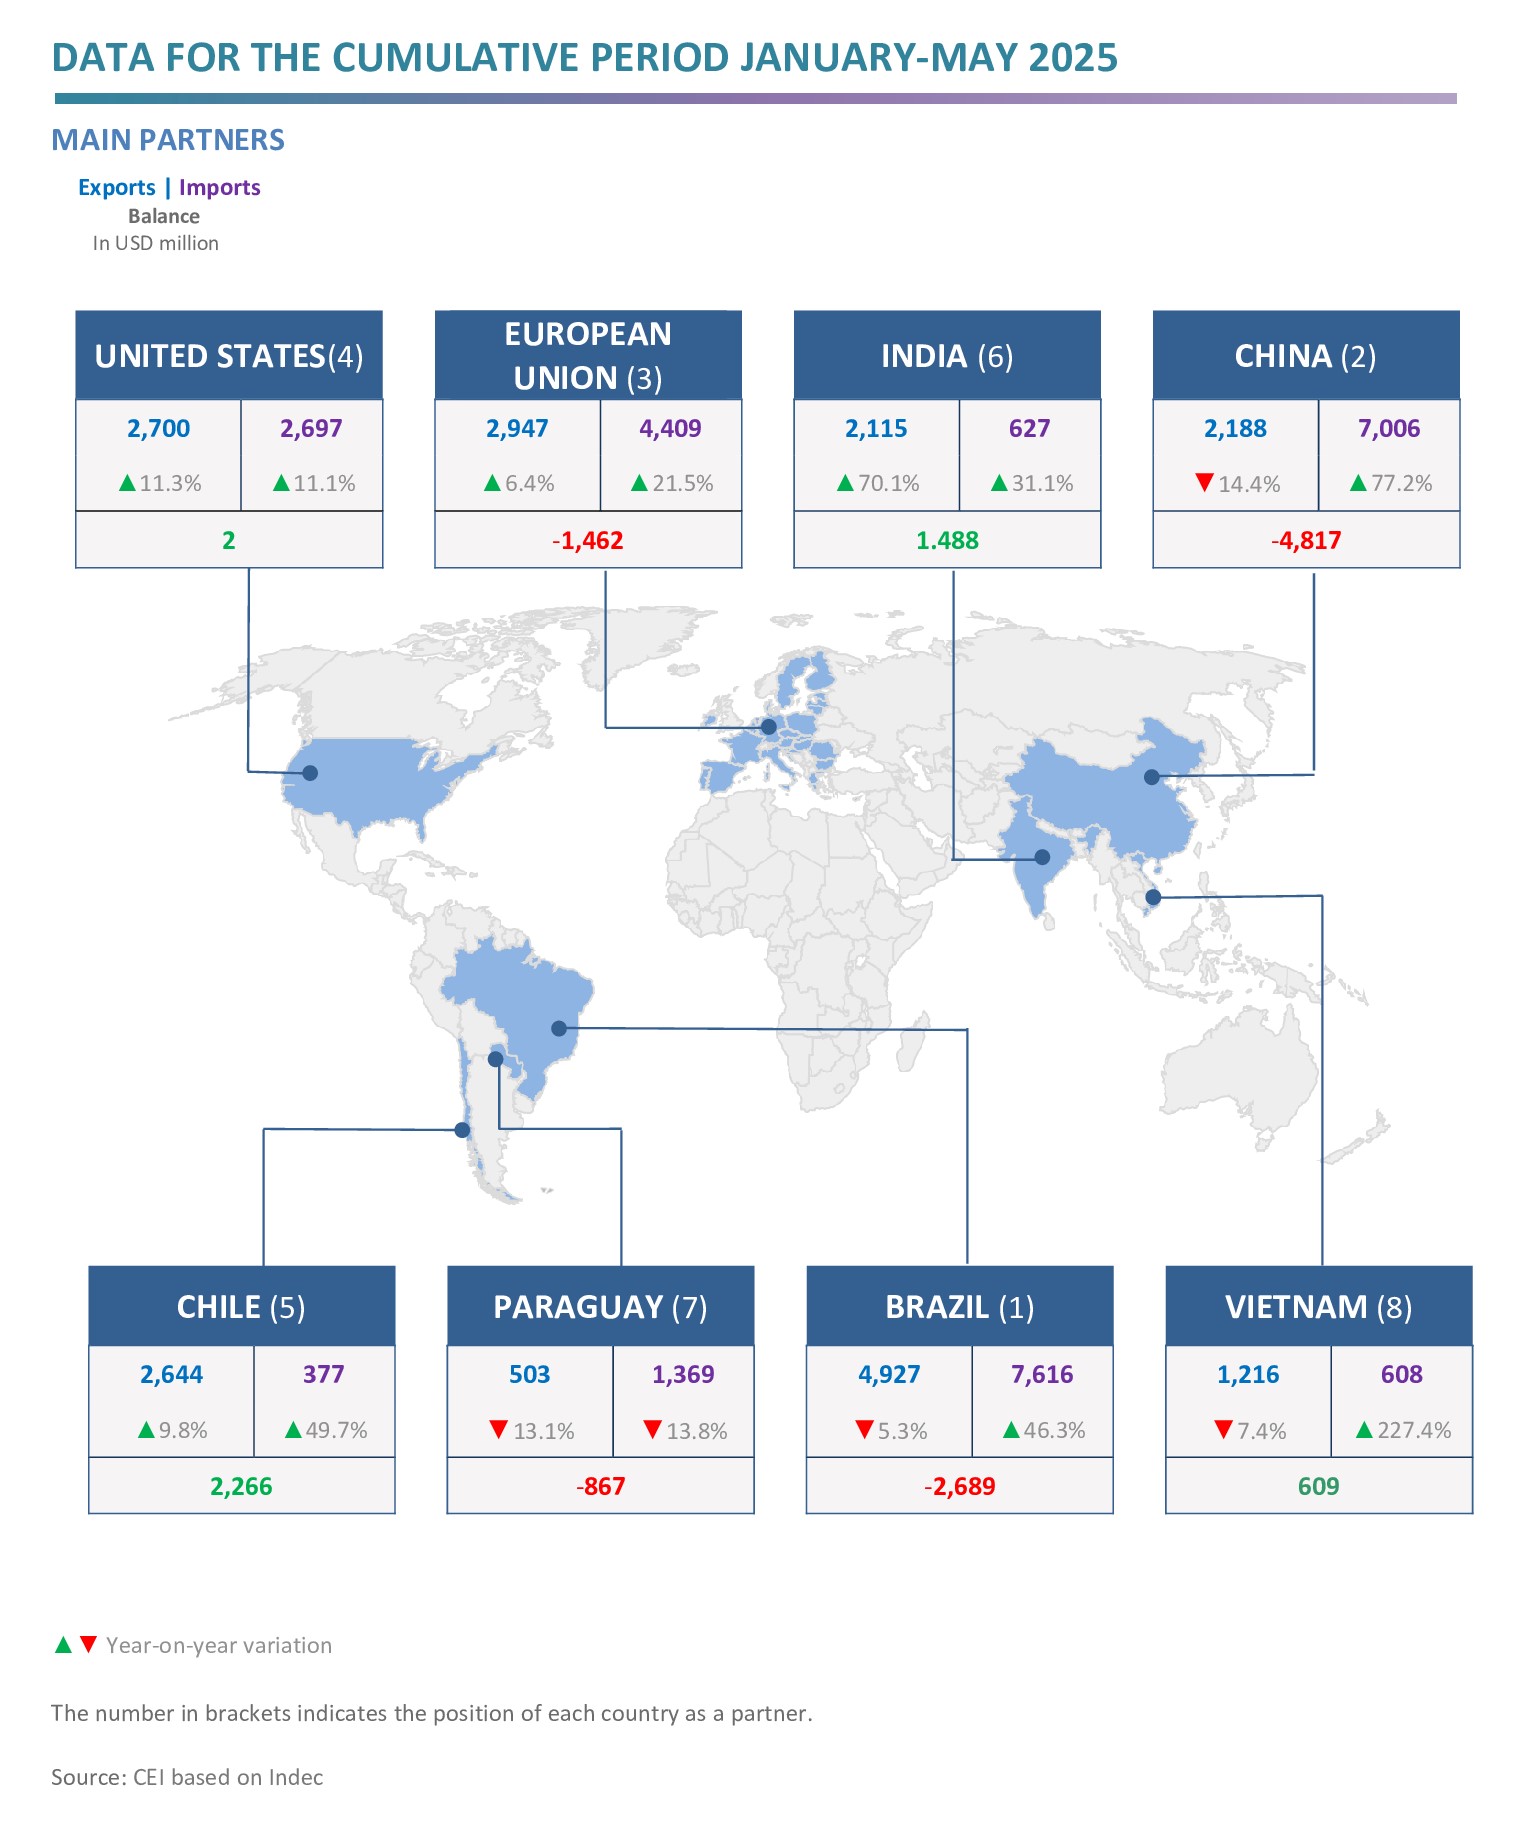
- The main export destinations were Brazil, with a 15.2% share, the EU, 9.1%, the the United States, 8.3%, and Chile, 8.1%. In turn, the most outstanding origin of imports were: Brazil, 24.9% of total imports; China, 22.9%; the EU, 14.4%, and the United States, 8.8%.
- The largest surpluses were obtained in trade with Chile (USD 2,266 million), India (USD 1.488 million), Peru (USD 920 million), Saudi Arabia (USD 788 million) and Switzerland (USD 712 million); while the main deficits were registered with China (‑USD 4.817 million), Brazil (‑USD 2.689 million) and Germany (‑USD 946 million).
Documentos relacionados:
Galería: