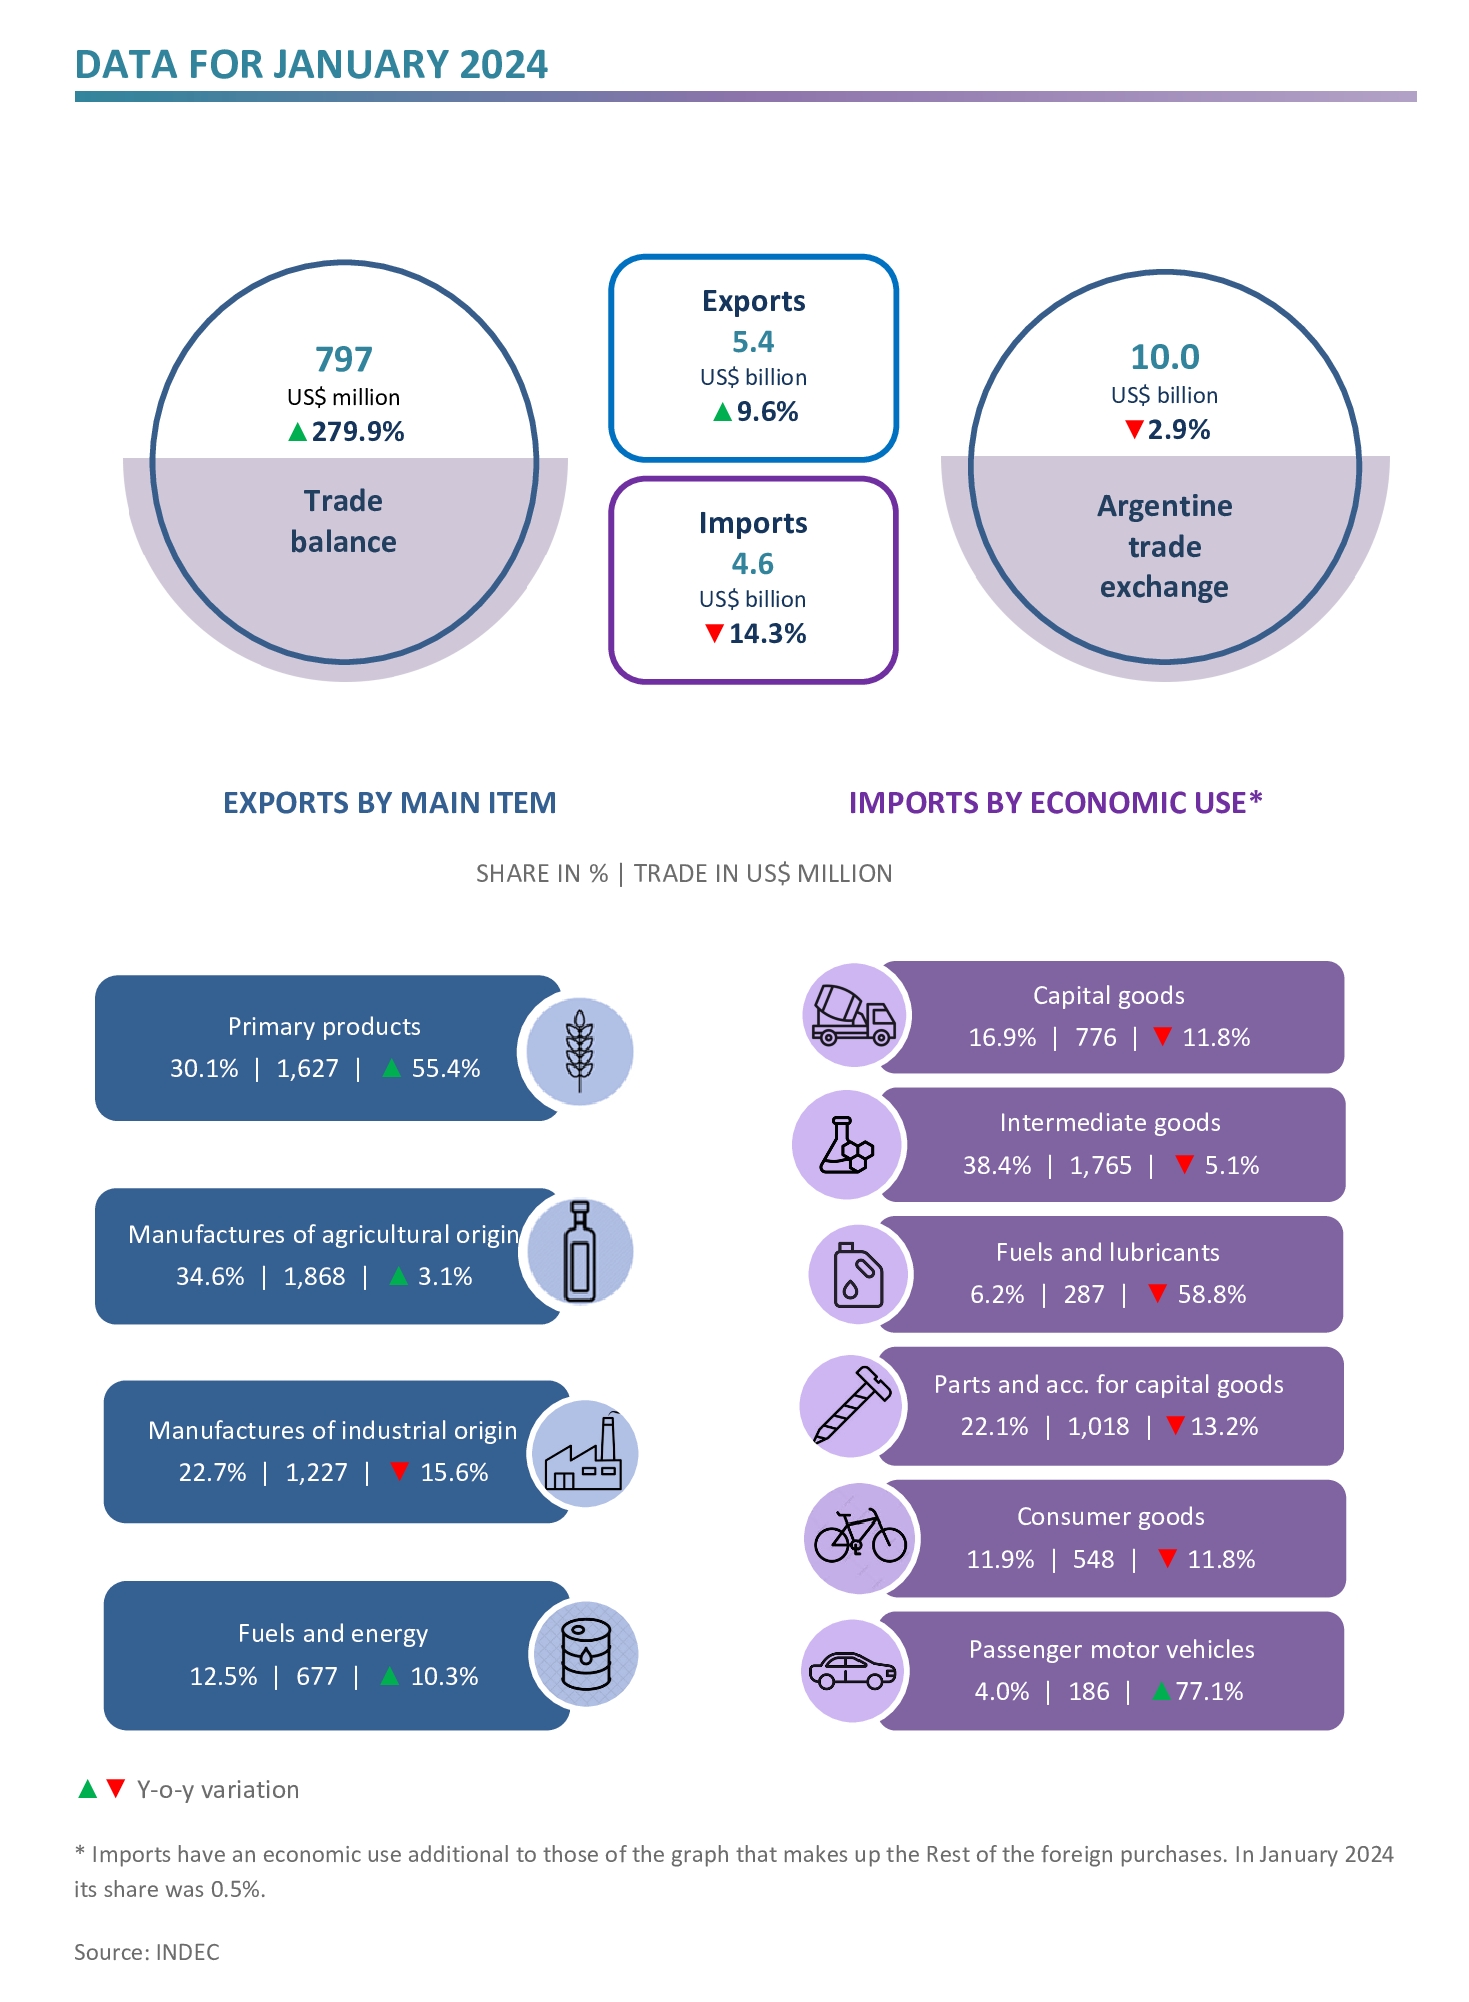
In the first month of 2024 exports reached US$ 5.4 billion, while imports amounted to US$ 4.6 billion and the trade balance recorded a surplus of US$ 797 million.
Highlights:
- In January, exports totalled US$ 5.4 billion, an increase of 9.6%, after 13 consecutive months of decline. The growth in the value exported is explained by the higher quantities exported (21.1%), mainly of Primary products and Fuels and energy, while prices decreased (−9.4%).
- Imports amounted to US$ 4.6 billion and fell by 14.3% y-o-y, due to decreases of 3.6% and 11.3% in prices and quantities, respectively. This was mainly due to lower imports of Capital goods and their Parts and accessories, and to decreases in prices and quantities of Fuels and lubricants, and Consumer goods. On the other hand, imports of Motor vehicles increased, due to higher quantities.
- The trade balance recorded a surplus of US$ 797 million, while in January 2023 it had reached a deficit of US$ 433 million.

- The most significant increases in exports were in wheat (US$ 416 million), crude petroleum oils (US$ 130 million), maize (US$ 127 million) and soybean meal (US$ 70 million), while external sales of soybean oil (−US$ 92 million) and natural gas in gaseous state (−US$ 48 million) decreased.
- In relation to the soybean complex, prices of crude oil (−28.3%), beans (−13.2%) and meal and pellets (−7.6%) fell. As for the quantities exported, those of beans (3263.2%), meal and pellets (21.7%) and crude oil (4.9%) increased.
- Regarding imports, the most prominent purchases were parts for gas turbines (they grew by US$ 60 million), urea with nitrogen content (US$ 59 million) and soy beans (US$ 53 million), while those of diesel oil (−US$ 228 million), parts of telephony and broadcasting, transmitting or receiving apparatus (−US$ 164 million) and diesel oil (−US$ 84 million) decreased.

- The main export destinations were Brazil, with a share of 15.9%, China, 8.4%, the United States, 8.1%, and the EU, 8.1%. The same partners stood out as import origins: China, 22.0%, Brazil, 19.3%, the EU, 19.3%, and the US, 11.6%.
-The largest surpluses were obtained in trade with Chile (US$ 352 million), Peru (US$ 234 million), Indonesia (US$ 213 million) and Algeria (US$ 121 million); while the main deficits were recorded with China (−US$ 558 million), the EU (−US$ 451 million) and the United States (−US$ 96 million).